
All examples · Example 23 of 34
Dose–Response Curve: IC50
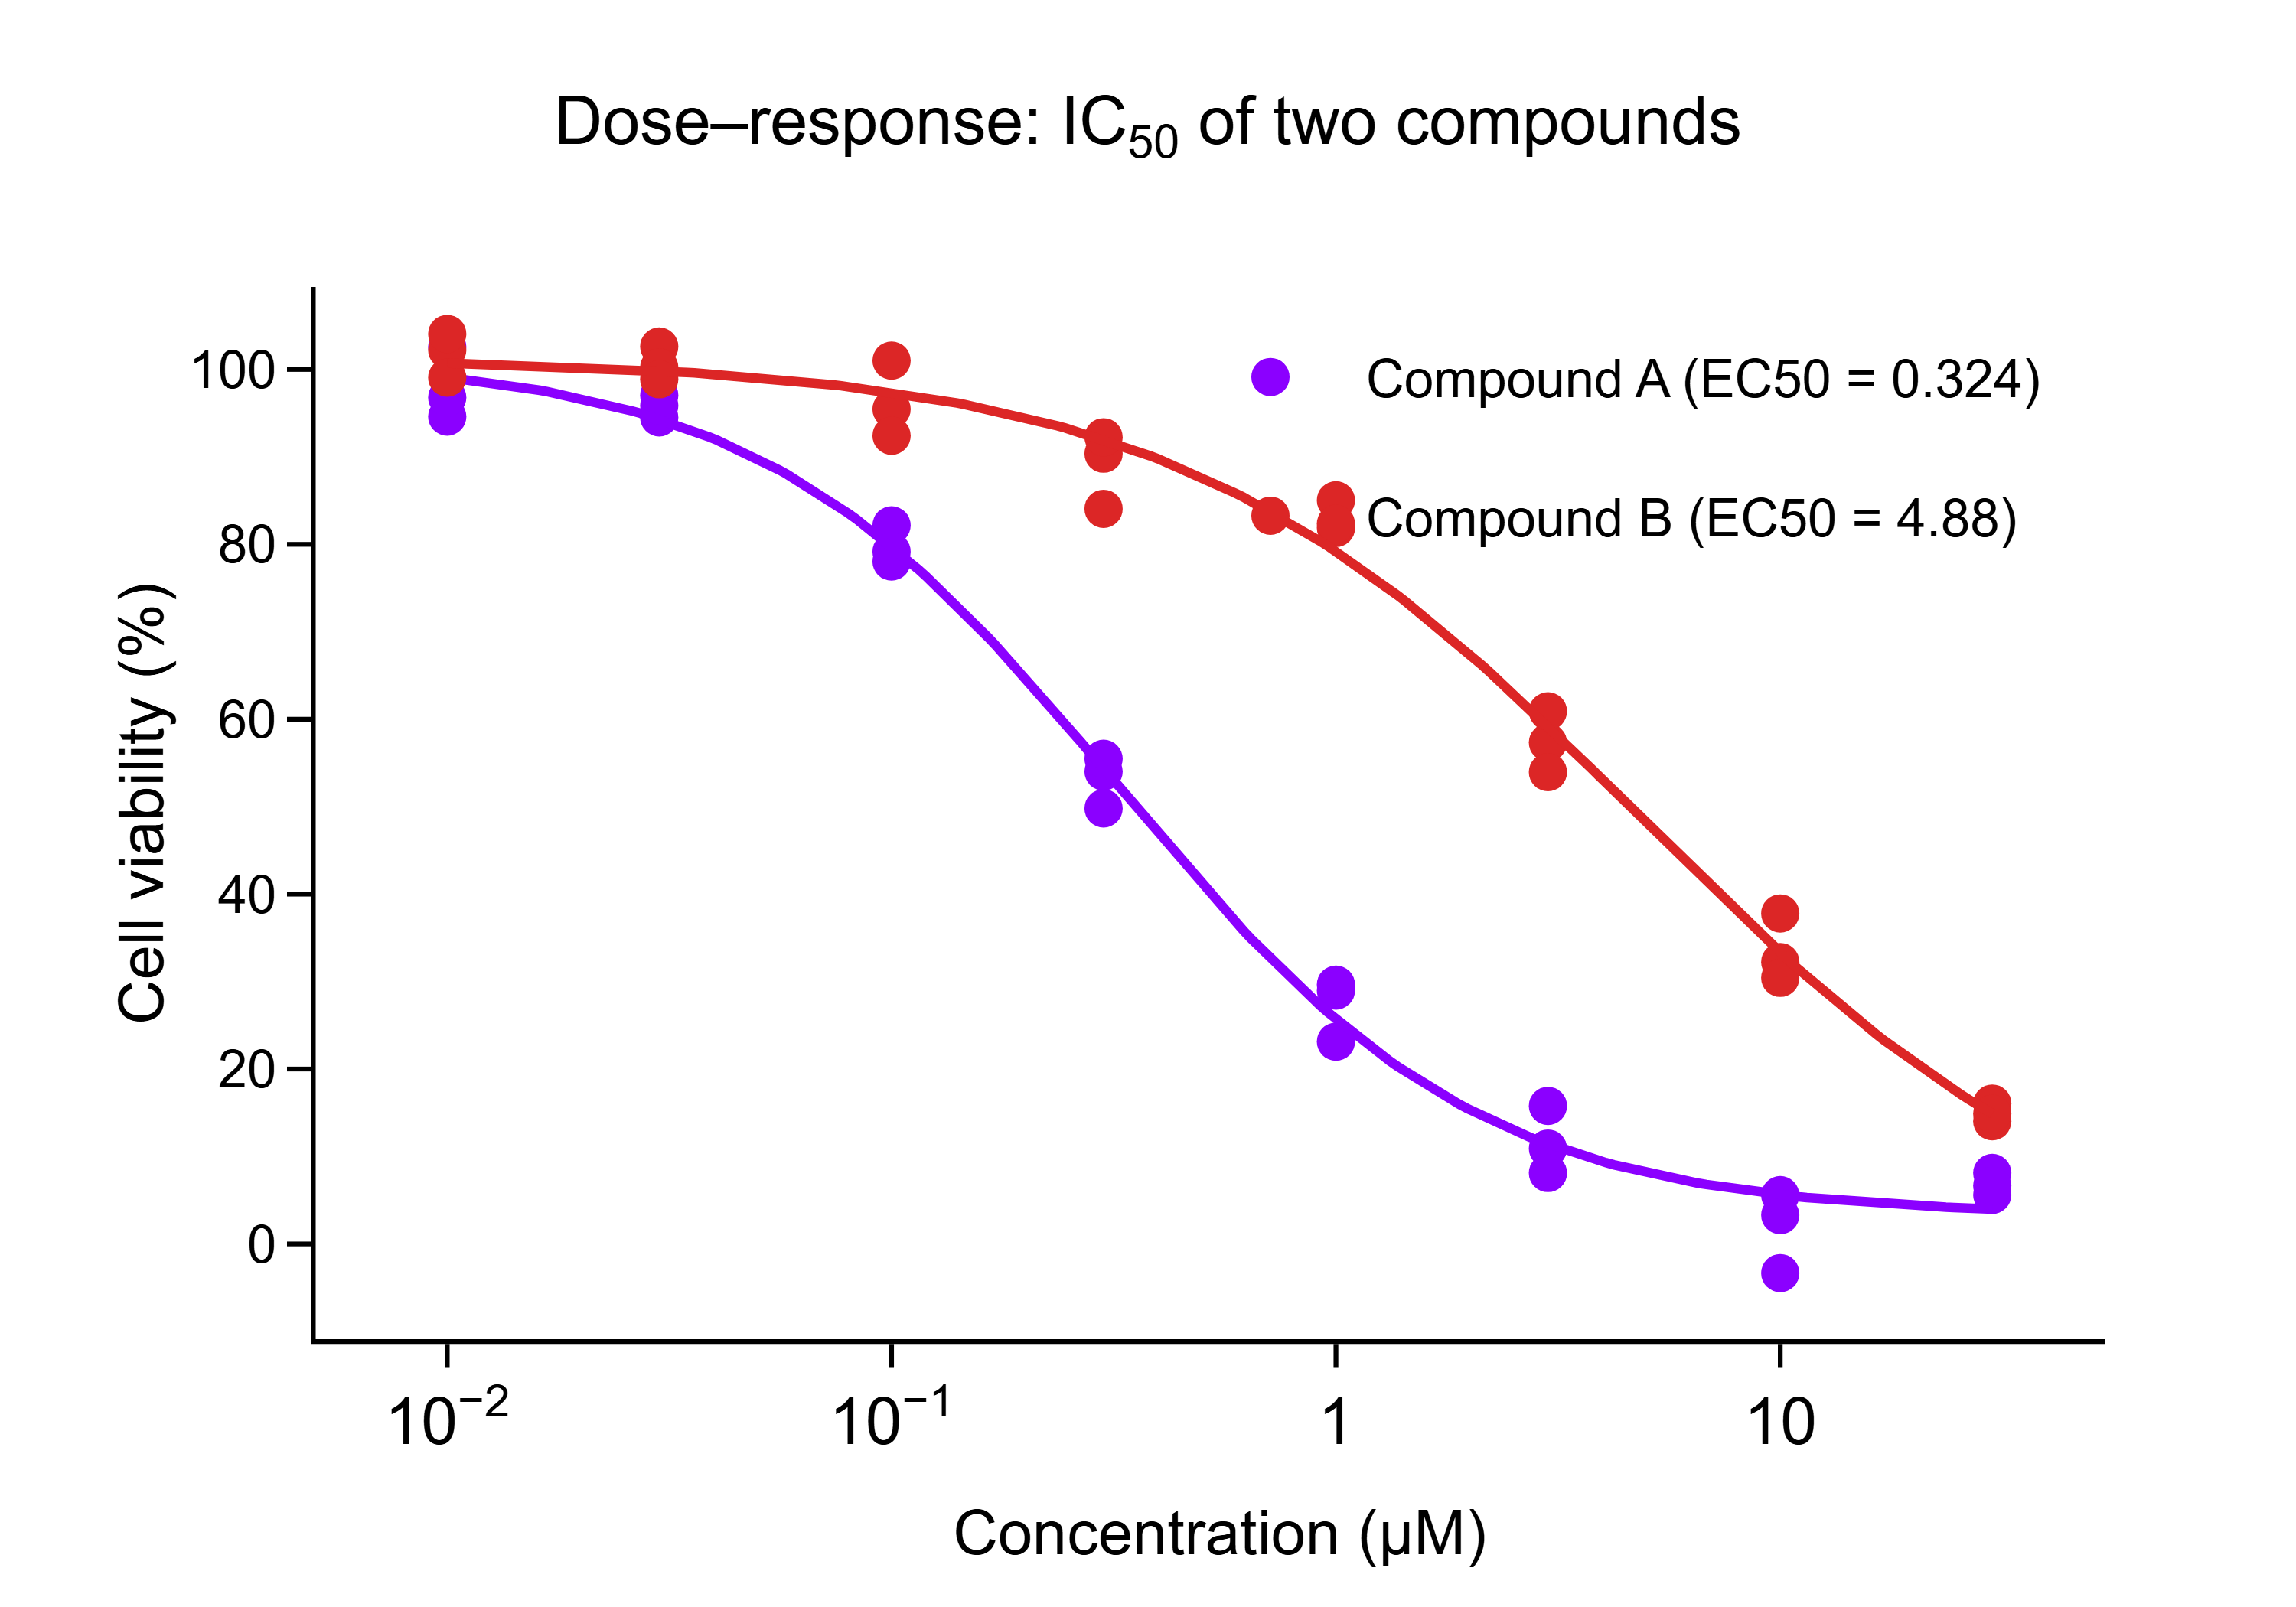
Cell viability against concentration for two compounds (triplicate wells) with four-parameter logistic fits.

Key findings
- Compound A is ~15.1× more potent (IC50 0.324 µM vs 4.88 µM, four-parameter logistic fits).
- Two-way ANOVA: compound × concentration interaction p = 1.8 × 10⁻¹⁶; the compounds differ at 6 of 8 concentrations after Holm correction — in the middle of the curve, where it is steepest.
Two-way ANOVA: Compound × Concentration
Compound × concentration as a factorial design. A significant interaction is the ANOVA's way of saying the two dose–response curves are shifted relative to each other — the same thing the IC50s quantify.
| Source | SS | df | MS | F | p | Partial η² |
|---|---|---|---|---|---|---|
| Compound | 7,673.7 | 1 | 7,673.7 | 763.3 | 6.7 × 10⁻²⁴ | 0.96 |
| Concentration | 52,986 | 7 | 7,569.5 | 752.9 | 1.2 × 10⁻³³ | 0.994 |
| Compound × Concentration | 4,135.9 | 7 | 590.85 | 58.77 | 1.8 × 10⁻¹⁶ | 0.928 |
| Residual | 321.71 | 32 | 10.053 |
LabTools call
stats.anovalabtools stats anova --design two-way --cells @cells.json --factor-a-name Compound --factor-b-name Concentration
The same method is available as an MCP tool (stats_anova) and from the desktop app's statistics panel.
LabTools notes
- The interaction is significant, so the main effects are not interpretable on their own — the effect of one factor depends on the level of the other. Report simple effects at each level instead.
Where do the compounds differ?
At each of the 8 concentrations, Compound A vs Compound B by Welch's t-test (triplicates), corrected across the 8 concentrations.
8 tests, α = 0.05
| Correction | Controls | Tests | Raw p < 0.05 | Significant after correction |
|---|---|---|---|---|
| Bonferroni | family-wise error | 8 | 7 | 5 |
| Holm | family-wise error | 8 | 7 | 6 |
| Benjamini–Hochberg | false discovery rate | 8 | 7 | 7 |
| Benjamini–Yekutieli | false discovery rate | 8 | 7 | 6 |
LabTools calls (5)
stats.ttestlabtools stats ttest --a @A_0.01uM.json --b @B_0.01uM.json --test welch --no-assumption-checks
stats.adjustlabtools stats adjust --p-values @p_values.json --labels @labels.json --method bonferroni --alpha 0.05
stats.adjustlabtools stats adjust --p-values @p_values.json --labels @labels.json --method holm --alpha 0.05
stats.adjustlabtools stats adjust --p-values @p_values.json --labels @labels.json --method benjamini-hochberg --alpha 0.05
stats.adjustlabtools stats adjust --p-values @p_values.json --labels @labels.json --method benjamini-yekutieli --alpha 0.05
The same method is available as an MCP tool (stats_ttest) and from the desktop app's statistics panel.
Top 8 by raw p
| Concentration | Compound A mean | Compound B mean | Difference | Raw p | Bonferroni | Holm | BH | BY |
|---|---|---|---|---|---|---|---|---|
| 3 µM | 11.61 | 57.4 | -45.79 | 0.0001 | 0.0009 | 0.0009 | 0.0008 | 0.002 |
| 1 µM | 27.25 | 83.09 | -55.84 | 0.0002 | 0.002 | 0.001 | 0.0008 | 0.002 |
| 0.3 µM | 53.1 | 88.89 | -35.79 | 0.0005 | 0.004 | 0.003 | 0.001 | 0.004 |
| 10 µM | 1.85 | 33.49 | -31.64 | 0.0009 | 0.008 | 0.005 | 0.002 | 0.005 |
| 30 µM | 6.803 | 14.99 | -8.187 | 0.001 | 0.009 | 0.005 | 0.002 | 0.005 |
| 0.1 µM | 79.79 | 96.3 | -16.51 | 0.011 | 0.085 | 0.032 | 0.014 | 0.038 |
| 0.03 µM | 95.81 | 100.6 | -4.767 | 0.028 | 0.22 | 0.056 | 0.032 | 0.087 |
| 0.01 µM | 97.99 | 101.8 | -3.787 | 0.26 | 1.00 | 0.26 | 0.26 | 0.71 |
LabTools notes
- 2 comparison(s) were significant on the raw p-values but are not after correction. Report the adjusted values.
- Holm controls the same familywise error rate as Bonferroni and rejects at least as much, so there is no statistical reason to prefer bonferroni.
- 1 comparison(s) were significant on the raw p-values but are not after correction. Report the adjusted values.
Methods paragraph
Written to go straight into a manuscript.
Four-parameter logistic curves gave IC50 values of 0.32 µM for Compound A and 4.88 µM for Compound B, a 15-fold difference in potency.
Every number on this page was computed by the LabTools statistics engine (version 0.14.3) from the example's CSV on 2026-09-23. Where a value was derived before the data reached LabTools (replicate means, paired differences, log odds ratios), the text says so. The data are simulated from a fixed random seed.
Get started
Run the same analysis on your data
Every test on this page is built into LabTools — from the statistics panel, the command line, or an AI assistant through MCP.