
All examples · Example 1 of 34
Protein Expression Histogram
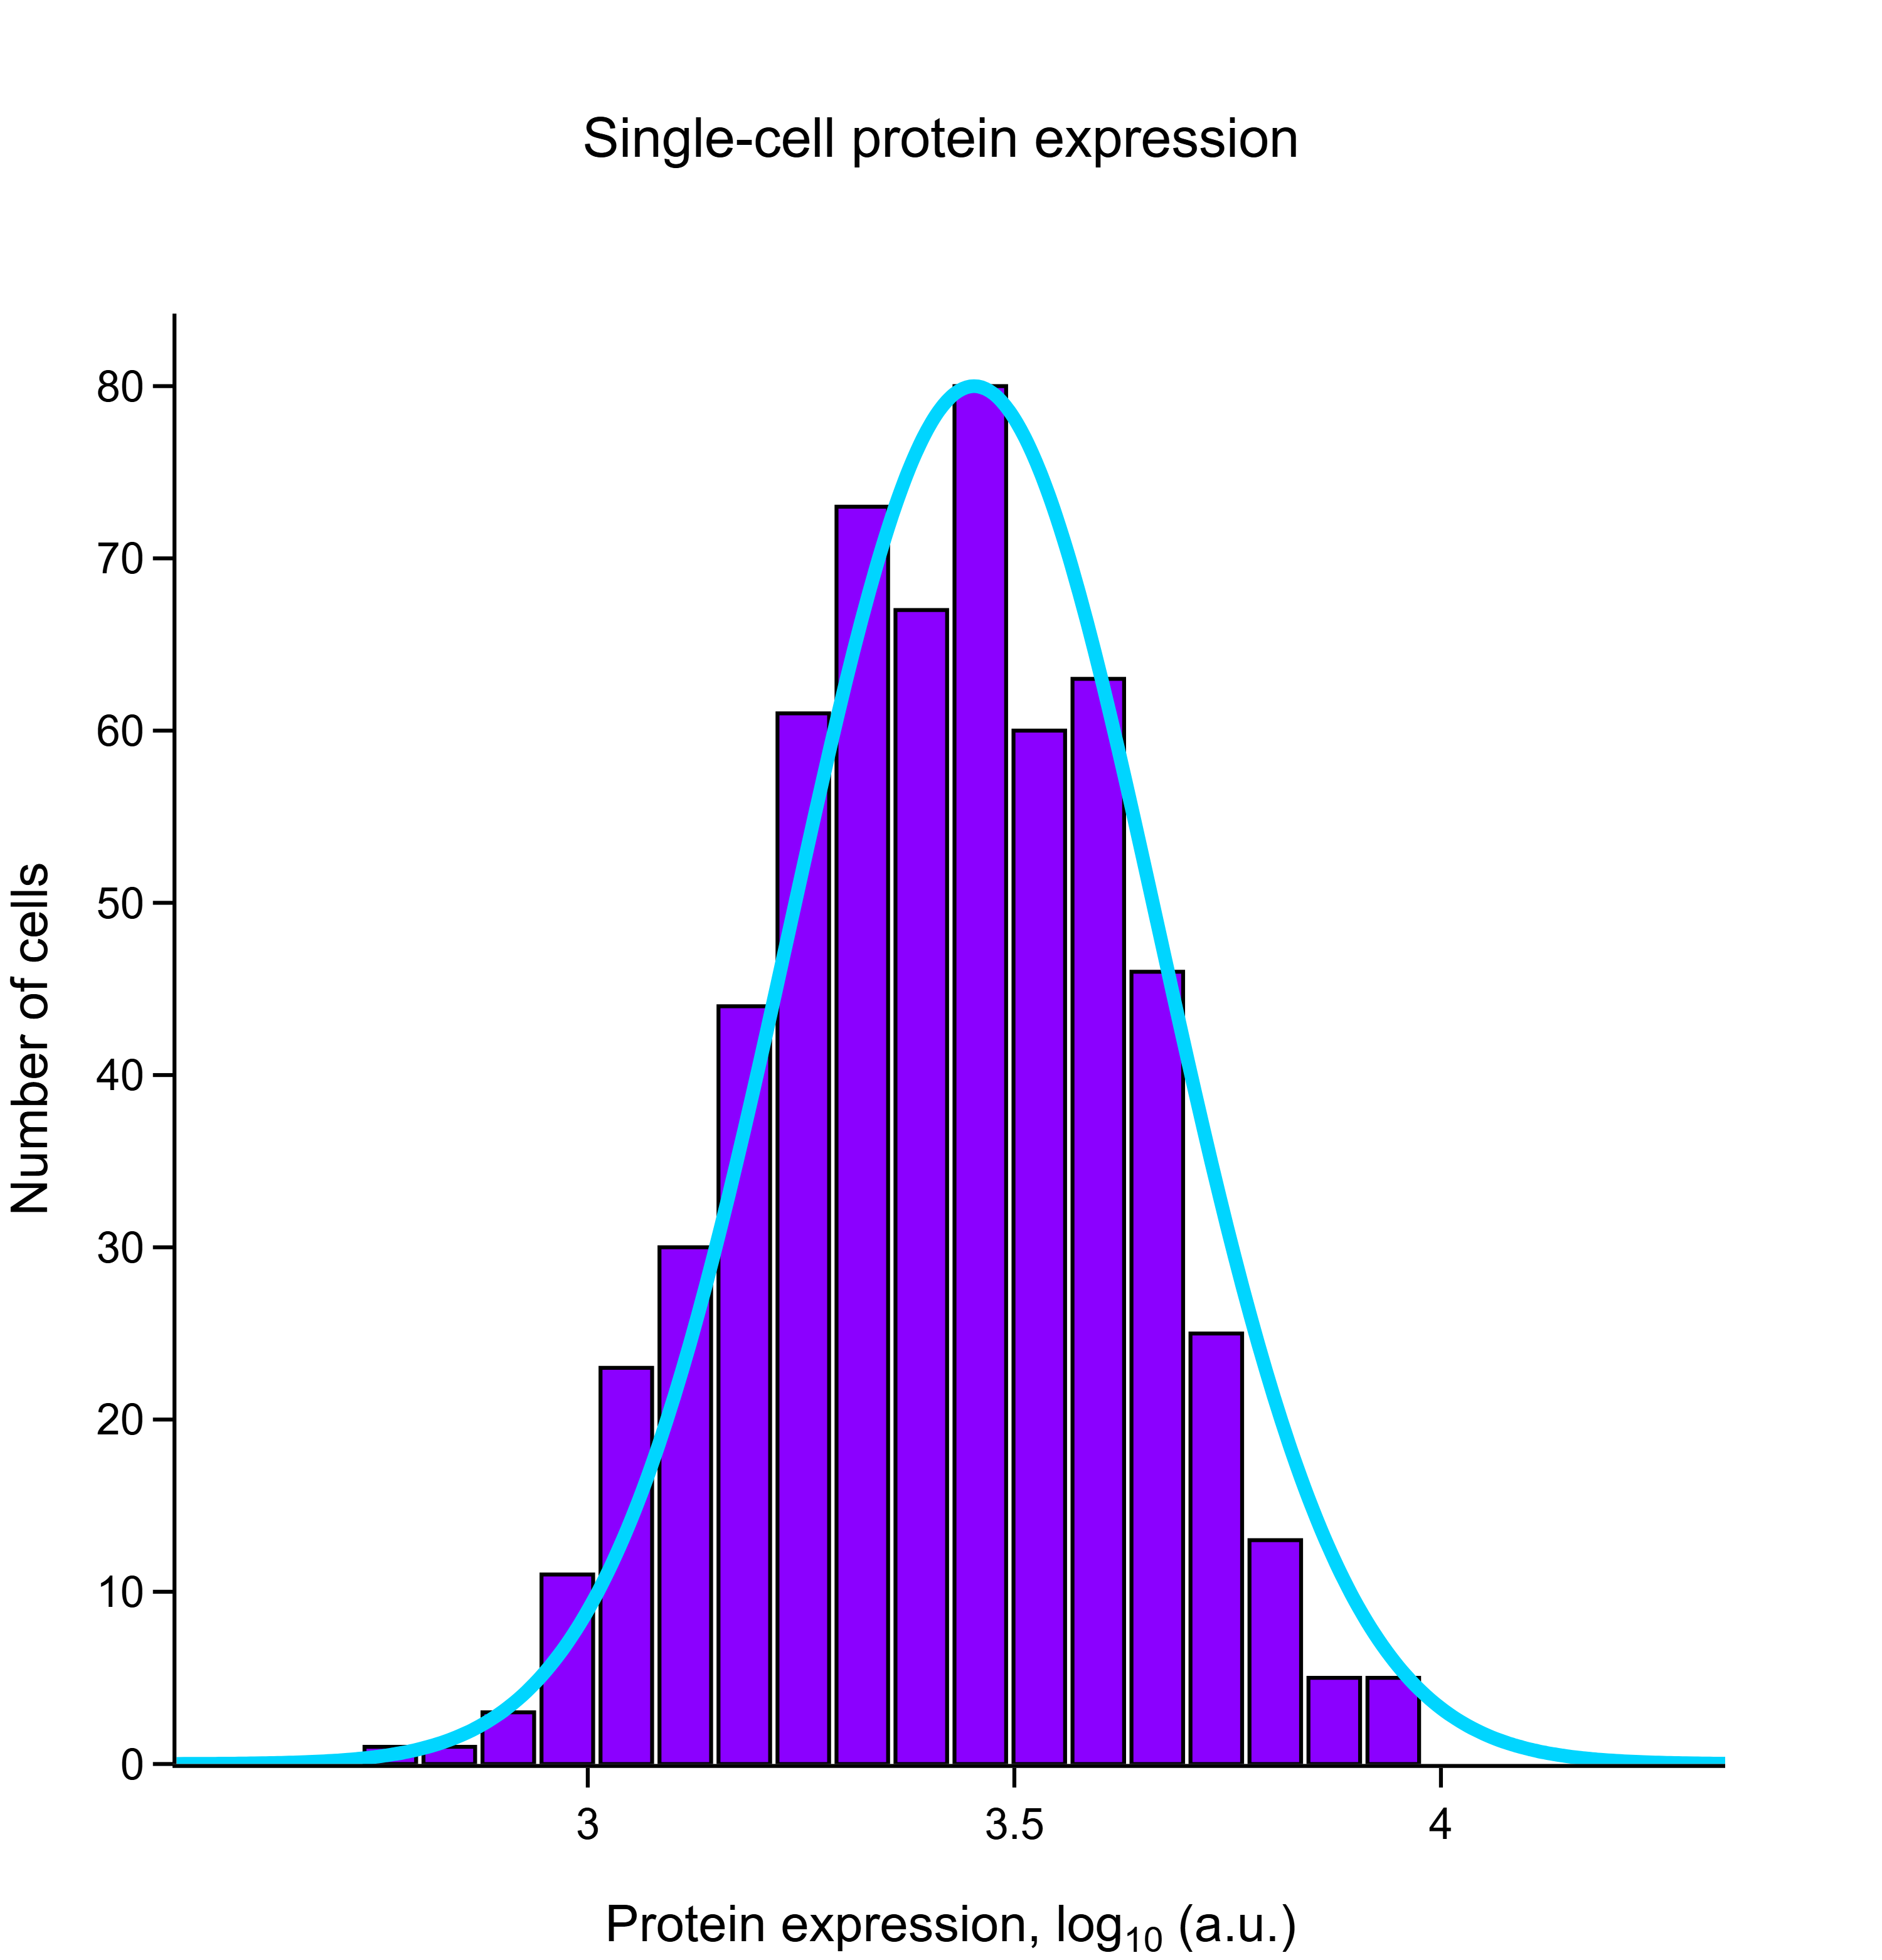
Distribution of single-cell protein expression (log10 a.u.; n = 612 cells) with a fitted Gaussian (cyan).

Key findings
- n = 612 cells; mean ± SD 3.413 ± 0.2113 log10 a.u.
- All three normality tests agree the data are consistent with a normal distribution (Shapiro–Wilk p = 0.80).
- A Gaussian mixture prefers k = 1 component by BIC — one population, as the single fitted curve assumes.
Descriptive statistics
Location, spread and shape for every group — the first thing to read before choosing a test. Skewness near 0 and excess kurtosis near 0 are what a normal distribution looks like.
| Group | n | Mean | SD | SEM | Median | Q1 – Q3 | Min – Max | Skewness | Excess kurtosis |
|---|---|---|---|---|---|---|---|---|---|
| Protein expression | 612 | 3.413 | 0.2113 | 0.00854 | 3.42 | 3.264 – 3.568 | 2.734 – 4.117 | -0.0164 | -0.197 |
LabTools call
stats.describelabtools stats describe --groups @groups.json
The same method is available as an MCP tool (stats_describe) and from the desktop app's statistics panel.
Normality
Three tests of the same question — could these values come from a normal distribution? Shapiro–Wilk has the best power at bench sample sizes, Anderson–Darling is more sensitive in the tails, and Kolmogorov–Smirnov (Lilliefors-corrected) is included for comparability with older papers. A significant p means normality is rejected.
| Group | n | Shapiro–Wilk W | p | Anderson–Darling A² | p | K–S D | p | Verdict |
|---|---|---|---|---|---|---|---|---|
| Protein expression | 612 | 0.9982 | 0.80 | 0.3591 | 0.45 | 0.02008 | 0.79 | Consistent with normal |
LabTools calls (3)
stats.normalitylabtools stats normality --groups @groups.json --method shapiro-wilk
stats.normalitylabtools stats normality --groups @groups.json --method anderson-darling
stats.normalitylabtools stats normality --groups @groups.json --method kolmogorov-smirnov
The same method is available as an MCP tool (stats_normality) and from the desktop app's statistics panel.
LabTools notes
- Group 'Protein expression' has n = 612; at this size a normality test flags departures far too small to affect a t-test. Judge by the skewness/kurtosis and a QQ plot instead.
Confidence intervals for the mean
t-based intervals: the range of population means these data are consistent with. Report them alongside p-values — an interval shows the size of an effect, a p-value does not.
| Group | n | Mean | 95% CI | 99% CI |
|---|---|---|---|---|
| Protein expression | 612 | 3.413 | [3.397, 3.43] | [3.391, 3.436] |
LabTools calls (2)
stats.cilabtools stats ci --data @Protein_expression.json --conf-level 0.95
stats.cilabtools stats ci --data @Protein_expression.json --conf-level 0.99
The same method is available as an MCP tool (stats_ci) and from the desktop app's statistics panel.
Outlier screen
Five detectors with different assumptions. Grubbs tests the single most extreme point, generalised ESD looks for up to several (immune to masking), Dixon's Q is the small-sample chemistry test, modified-z uses the median and MAD so needs no normality, and the IQR rule is Tukey's boxplot fence. LabTools flags points; it never deletes them.
| Method | Protein expression |
|---|---|
| Grubbs | none |
| Generalised ESD | none |
| Modified z (MAD) | none |
| IQR fences (1.5×) | 2 (2.734, 4.117) |
LabTools calls (4)
stats.outlierslabtools stats outliers --groups @groups.json --method grubbs
stats.outlierslabtools stats outliers --groups @groups.json --method generalized-esd --max-outliers 5
stats.outlierslabtools stats outliers --groups @groups.json --method modified-z
stats.outlierslabtools stats outliers --groups @groups.json --method iqr
The same method is available as an MCP tool (stats_outliers) and from the desktop app's statistics panel.
LabTools notes
- Grubbs tests only the single most extreme point, so a second outlier can mask the first. On larger samples use method='generalized_esd'.
- Flagged points are candidates, not verdicts, and nothing has been removed. Look for a physical cause before excluding anything; if there is none, keep the point and use a robust test instead. Any exclusion must be reported.
- The IQR rule is descriptive — it has no p-value and flags roughly 0.7% of a perfectly normal sample by construction.
How many populations? (Gaussian mixture)
Fits 1, 2 … k Gaussian components by EM (10 restarts, fixed seed, so the numbers are reproducible) and compares them by BIC, which is consistent for the number of components. best k = 1 is positive evidence for a single population.
Protein expression (n = 612) — best k by BIC = 1, by AIC = 1
| k | log-likelihood | AIC | BIC | Converged | Components (weight, mean, SD) |
|---|---|---|---|---|---|
| 1 ★ | 83.5768 | -163.154 | -154.32 | yes | 100.0% at μ = 3.413 (σ = 0.2111) |
| 2 | 84.8361 | -159.672 | -137.589 | no | 39.4% at μ = 3.256 (σ = 0.1626); 60.6% at μ = 3.516 (σ = 0.1724) |
| 3 | 85.3545 | -154.709 | -119.375 | no | 33.6% at μ = 3.266 (σ = 0.1538); 37.1% at μ = 3.443 (σ = 0.2233); 29.2% at μ = 3.546 (σ = 0.1349) |
LabTools call
stats.gmmlabtools stats gmm --groups @groups.json --k-max 3
The same method is available as an MCP tool (stats_gmm) and from the desktop app's statistics panel.
Methods paragraph
Written to go straight into a manuscript.
Expression values (n = 612) were binned automatically and fitted with a single Gaussian; normality was assessed by Shapiro–Wilk (W = 0.998, p = 0.80). Mean ± SD: 3.41 ± 0.21 log10 a.u.
Every number on this page was computed by the LabTools statistics engine (version 0.14.3) from the example's CSV on 2026-09-23. Where a value was derived before the data reached LabTools (replicate means, paired differences, log odds ratios), the text says so. The data are simulated from a fixed random seed.
Get started
Run the same analysis on your data
Every test on this page is built into LabTools — from the statistics panel, the command line, or an AI assistant through MCP.