
All examples · Example 19 of 34
Correlation Heatmap: Metabolomics
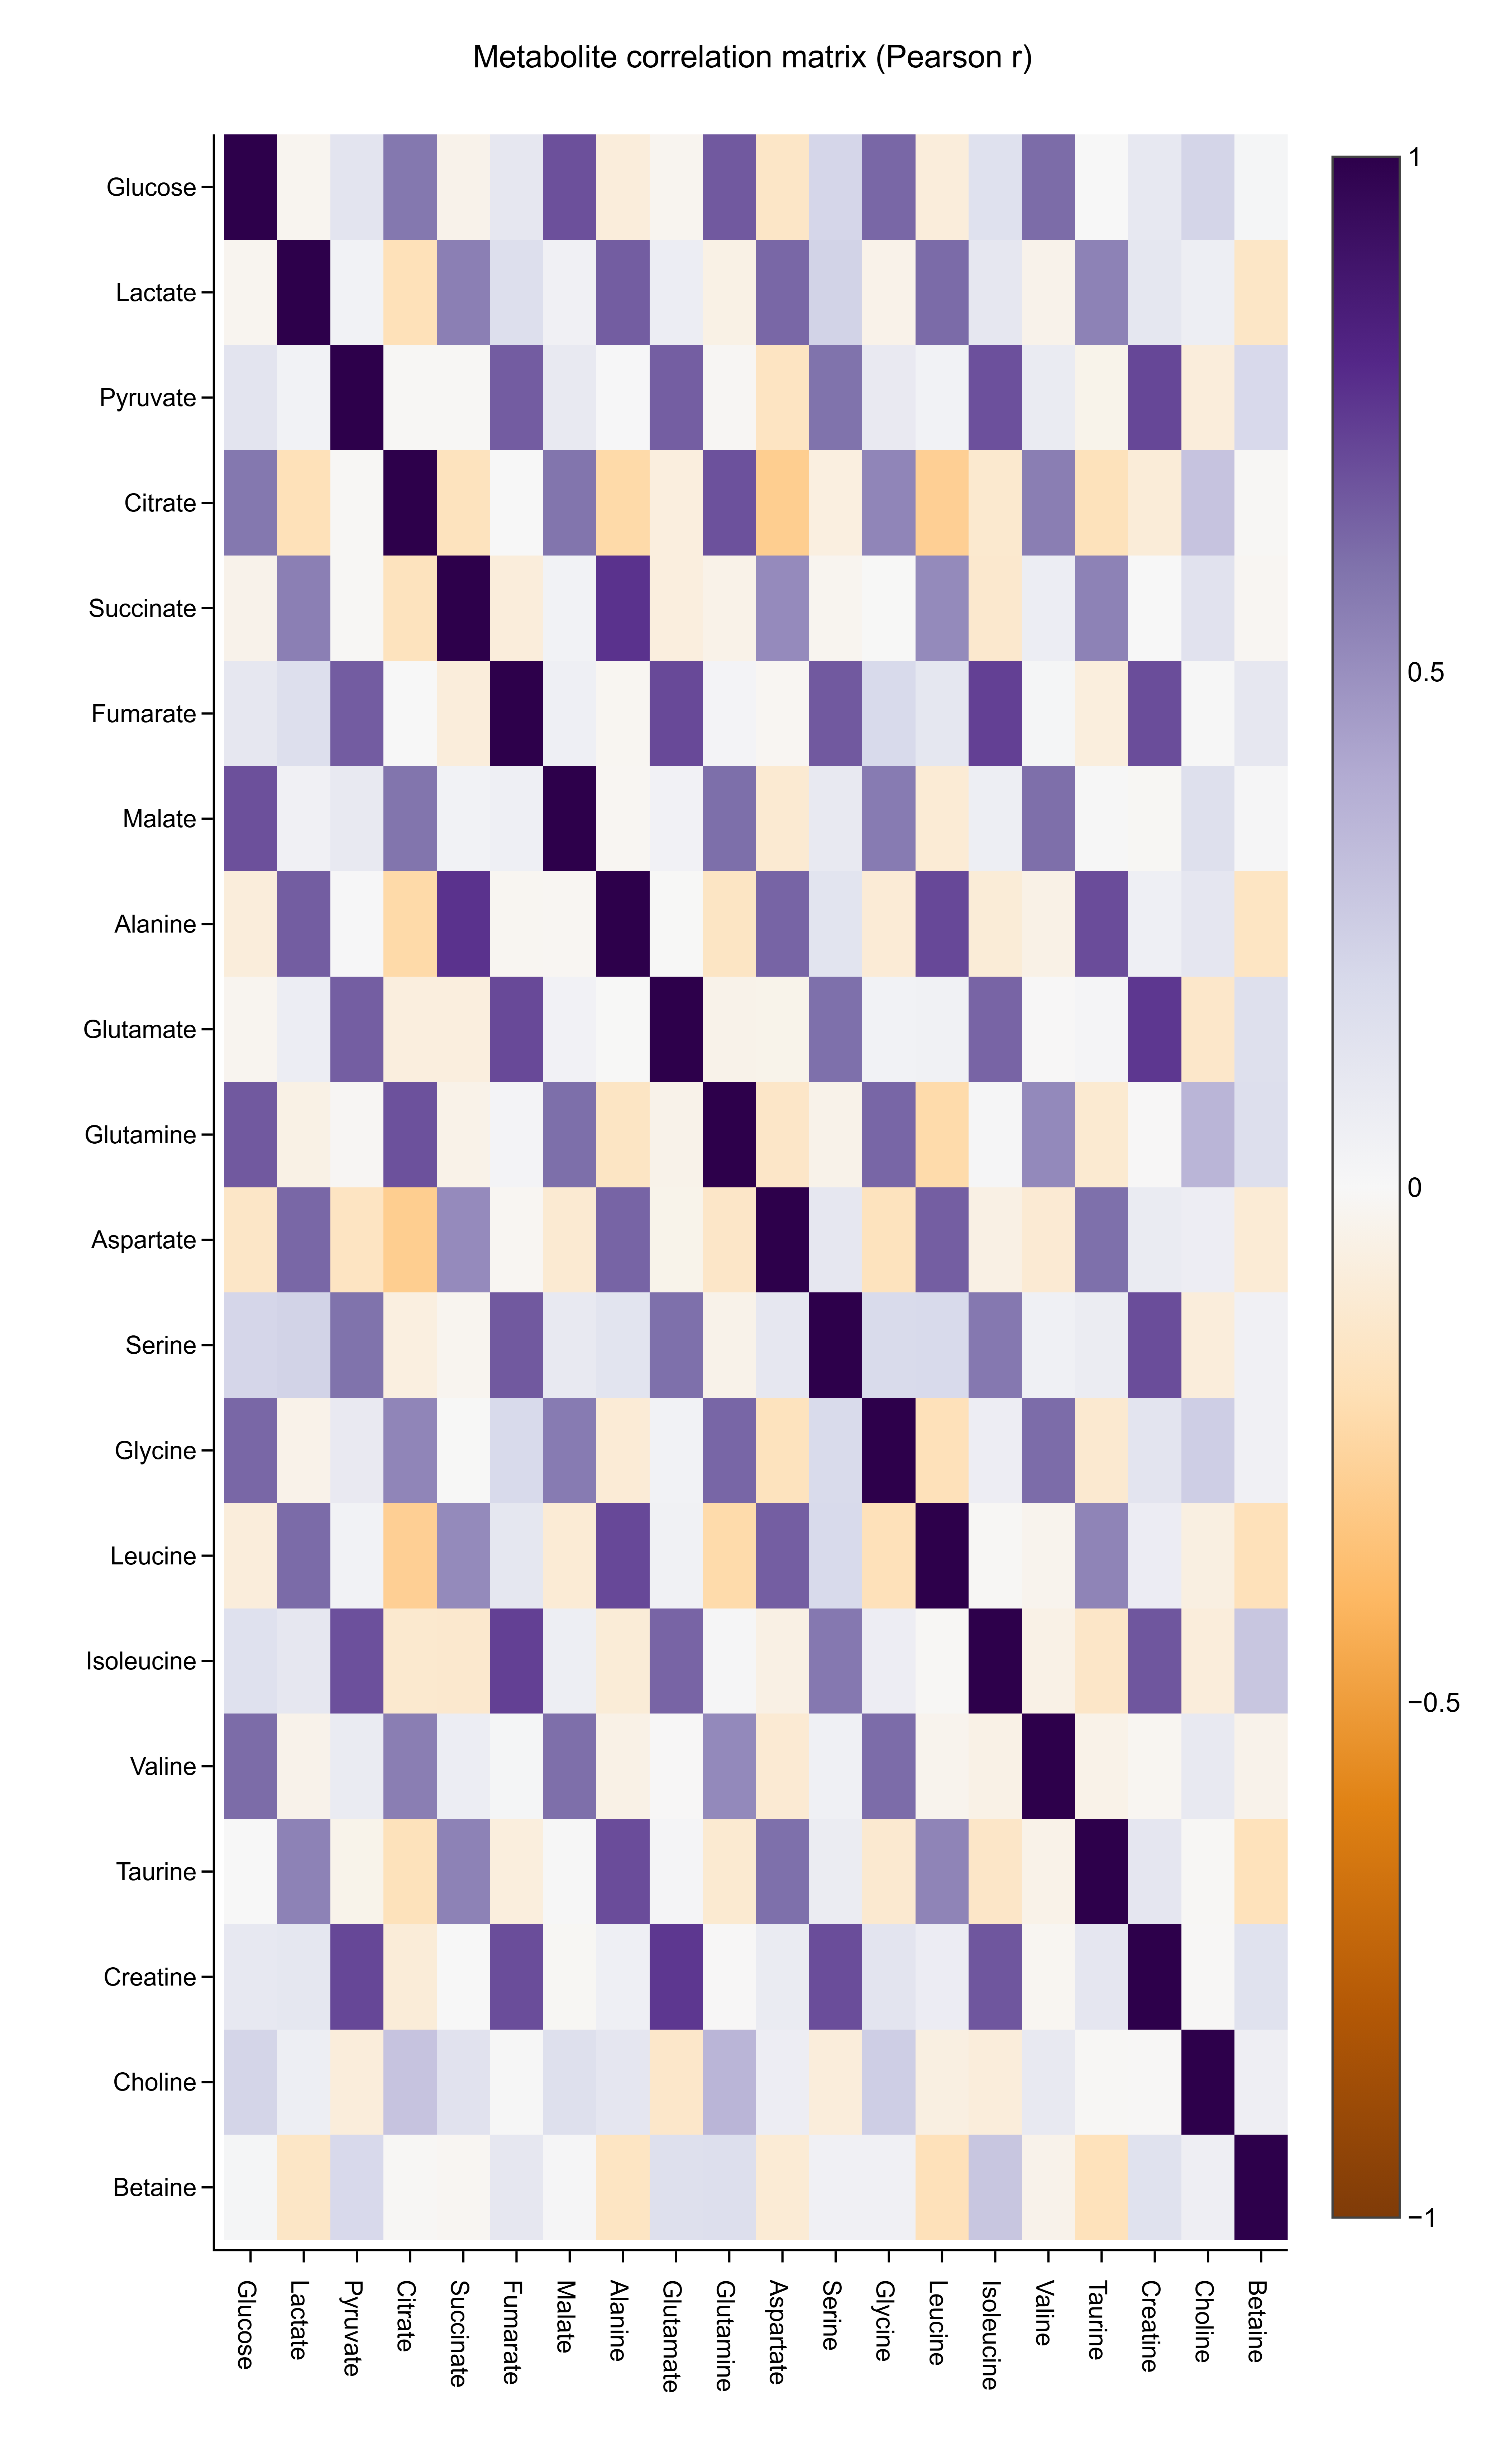
Pairwise Pearson correlation between 20 metabolites across 60 samples (purple positive, orange negative).

Key findings
- 46 of 190 metabolite pairs are significantly correlated after Benjamini–Hochberg correction (45 after Bonferroni).
- The strongest pair is Succinate – Alanine (r = 0.772); Spearman and Kendall rank the top pairs the same way, so they are not driven by outliers.
Descriptive statistics (20 metabolites)
Location, spread and shape for every group — the first thing to read before choosing a test. Skewness near 0 and excess kurtosis near 0 are what a normal distribution looks like.
| Group | n | Mean | SD | SEM | Median | Q1 – Q3 | Min – Max | Skewness | Excess kurtosis |
|---|---|---|---|---|---|---|---|---|---|
| Glucose | 60 | 10.04 | 1.893 | 0.2444 | 9.873 | 8.941 – 11.65 | 5.654 – 14.46 | -0.00328 | -0.263 |
| Lactate | 60 | 9.85 | 1.948 | 0.2514 | 9.912 | 8.705 – 11 | 5.796 – 13.98 | -0.0645 | -0.239 |
| Pyruvate | 60 | 9.922 | 1.956 | 0.2525 | 9.979 | 8.694 – 11.11 | 4.979 – 14.37 | -0.227 | 0.173 |
| Citrate | 60 | 10.11 | 1.785 | 0.2305 | 10.37 | 8.879 – 11.58 | 6.416 – 14.27 | -0.0769 | -0.559 |
| Succinate | 60 | 9.764 | 2.173 | 0.2805 | 10.1 | 8.107 – 11.3 | 3.932 – 13.63 | -0.501 | -0.167 |
| Fumarate | 60 | 9.779 | 2.145 | 0.277 | 9.279 | 8.297 – 11.27 | 4.406 – 15.19 | 0.309 | -0.186 |
| Malate | 60 | 9.998 | 2.189 | 0.2826 | 10.31 | 8.265 – 11.77 | 4.883 – 14.12 | -0.178 | -0.843 |
| Alanine | 60 | 10.09 | 2.101 | 0.2713 | 10.5 | 8.573 – 11.75 | 4.338 – 14.62 | -0.413 | -0.201 |
| Glutamate | 60 | 9.818 | 2.211 | 0.2854 | 9.989 | 8.199 – 11.37 | 4.997 – 14.05 | -0.16 | -0.758 |
| Glutamine | 60 | 9.813 | 1.776 | 0.2293 | 9.922 | 8.698 – 10.76 | 4.844 – 13.52 | -0.164 | 0.138 |
| Aspartate | 60 | 10.06 | 1.767 | 0.2281 | 10.06 | 8.845 – 11.28 | 5.585 – 13.32 | -0.199 | -0.424 |
| Serine | 60 | 9.873 | 1.929 | 0.249 | 10.02 | 8.86 – 11.27 | 5.273 – 13.3 | -0.412 | -0.511 |
| Glycine | 60 | 10.26 | 2.127 | 0.2746 | 10.43 | 8.86 – 11.61 | 5.278 – 14.56 | -0.14 | -0.184 |
| Leucine | 60 | 10.07 | 1.961 | 0.2532 | 10.27 | 9.098 – 11.04 | 4.504 – 14.37 | -0.418 | 0.828 |
| Isoleucine | 60 | 9.805 | 1.943 | 0.2508 | 9.936 | 8.314 – 11.02 | 5.634 – 15.18 | 0.403 | -0.0381 |
| Valine | 60 | 9.85 | 1.829 | 0.2362 | 9.94 | 8.479 – 11.06 | 5.89 – 14.48 | -0.0052 | 0.0544 |
| Taurine | 60 | 10.2 | 2.055 | 0.2653 | 10.14 | 8.744 – 11.52 | 4.762 – 14.54 | -0.283 | -0.0605 |
| Creatine | 60 | 10.04 | 1.776 | 0.2293 | 10.02 | 8.605 – 11.47 | 5.905 – 14.29 | 0.102 | -0.539 |
| Choline | 60 | 10.25 | 1.866 | 0.2409 | 10.53 | 8.976 – 11.7 | 4.909 – 13.9 | -0.496 | -0.135 |
| Betaine | 60 | 9.891 | 1.899 | 0.2452 | 9.768 | 8.508 – 11.22 | 4.942 – 13.87 | -0.109 | 0.0747 |
LabTools call
stats.describelabtools stats describe --groups @groups.json
The same method is available as an MCP tool (stats_describe) and from the desktop app's statistics panel.
Normality
Shapiro–Wilk on every metabolite: the Pearson coefficients in the heatmap assume roughly normal, outlier-free variables.
| Group | n | Shapiro–Wilk W | p | Verdict |
|---|---|---|---|---|
| Glucose | 60 | 0.9857 | 0.71 | Consistent with normal |
| Lactate | 60 | 0.9811 | 0.48 | Consistent with normal |
| Pyruvate | 60 | 0.9888 | 0.86 | Consistent with normal |
| Citrate | 60 | 0.986 | 0.72 | Consistent with normal |
| Succinate | 60 | 0.9755 | 0.27 | Consistent with normal |
| Fumarate | 60 | 0.9738 | 0.22 | Consistent with normal |
| Malate | 60 | 0.9738 | 0.22 | Consistent with normal |
| Alanine | 60 | 0.977 | 0.31 | Consistent with normal |
| Glutamate | 60 | 0.9787 | 0.38 | Consistent with normal |
| Glutamine | 60 | 0.9889 | 0.86 | Consistent with normal |
| Aspartate | 60 | 0.9837 | 0.60 | Consistent with normal |
| Serine | 60 | 0.9693 | 0.13 | Consistent with normal |
| Glycine | 60 | 0.9876 | 0.80 | Consistent with normal |
| Leucine | 60 | 0.9695 | 0.14 | Consistent with normal |
| Isoleucine | 60 | 0.9835 | 0.59 | Consistent with normal |
| Valine | 60 | 0.9861 | 0.73 | Consistent with normal |
| Taurine | 60 | 0.991 | 0.94 | Consistent with normal |
| Creatine | 60 | 0.9847 | 0.66 | Consistent with normal |
| Choline | 60 | 0.9743 | 0.23 | Consistent with normal |
| Betaine | 60 | 0.9854 | 0.69 | Consistent with normal |
LabTools call
stats.normalitylabtools stats normality --groups @groups.json --method shapiro-wilk
The same method is available as an MCP tool (stats_normality) and from the desktop app's statistics panel.
All 190 pairwise correlations, corrected
Every pair of metabolites is correlated (Pearson), which is one family of 190 tests. The p-values are corrected four ways; the table lists the strongest pairs, with Spearman and Kendall alongside as a robustness check.
190 tests, α = 0.05
| Correction | Controls | Tests | Raw p < 0.05 | Significant after correction |
|---|---|---|---|---|
| Bonferroni | family-wise error | 190 | 50 | 45 |
| Holm | family-wise error | 190 | 50 | 45 |
| Benjamini–Hochberg | false discovery rate | 190 | 50 | 46 |
| Benjamini–Yekutieli | false discovery rate | 190 | 50 | 45 |
LabTools calls (4)
stats.adjustlabtools stats adjust --p-values @p_values.json --labels @labels.json --method bonferroni --alpha 0.05
stats.adjustlabtools stats adjust --p-values @p_values.json --labels @labels.json --method holm --alpha 0.05
stats.adjustlabtools stats adjust --p-values @p_values.json --labels @labels.json --method benjamini-hochberg --alpha 0.05
stats.adjustlabtools stats adjust --p-values @p_values.json --labels @labels.json --method benjamini-yekutieli --alpha 0.05
The same method is available as an MCP tool (stats_adjust) and from the desktop app's statistics panel.
LabTools notes
- 5 comparison(s) were significant on the raw p-values but are not after correction. Report the adjusted values.
- Holm controls the same familywise error rate as Bonferroni and rejects at least as much, so there is no statistical reason to prefer bonferroni.
- 4 comparison(s) were significant on the raw p-values but are not after correction. Report the adjusted values.
Strongest 12 pairs
| Pair | Pearson r | p | BH-adjusted p | Spearman ρ | Kendall τ |
|---|---|---|---|---|---|
| Succinate – Alanine | 0.772 | 5.0 × 10⁻¹³ | 9.4 × 10⁻¹¹ | 0.742 | 0.558 |
| Glutamate – Creatine | 0.758 | 2.4 × 10⁻¹² | 2.3 × 10⁻¹⁰ | 0.784 | 0.564 |
| Fumarate – Isoleucine | 0.734 | 2.6 × 10⁻¹¹ | 1.6 × 10⁻⁹ | 0.683 | 0.506 |
| Pyruvate – Creatine | 0.716 | 1.2 × 10⁻¹⁰ | 5.9 × 10⁻⁹ | 0.731 | 0.542 |
| Alanine – Leucine | 0.712 | 1.8 × 10⁻¹⁰ | 6.4 × 10⁻⁹ | 0.672 | 0.488 |
| Fumarate – Glutamate | 0.711 | 2.0 × 10⁻¹⁰ | 6.4 × 10⁻⁹ | 0.742 | 0.546 |
| Alanine – Taurine | 0.702 | 4.1 × 10⁻¹⁰ | 1.0 × 10⁻⁸ | 0.668 | 0.482 |
| Serine – Creatine | 0.7 | 4.9 × 10⁻¹⁰ | 1.0 × 10⁻⁸ | 0.7 | 0.515 |
| Fumarate – Creatine | 0.7 | 4.9 × 10⁻¹⁰ | 1.0 × 10⁻⁸ | 0.701 | 0.494 |
| Glucose – Malate | 0.692 | 8.9 × 10⁻¹⁰ | 1.7 × 10⁻⁸ | 0.7 | 0.507 |
| Pyruvate – Isoleucine | 0.691 | 9.8 × 10⁻¹⁰ | 1.7 × 10⁻⁸ | 0.688 | 0.505 |
| Citrate – Glutamine | 0.689 | 1.1 × 10⁻⁹ | 1.8 × 10⁻⁸ | 0.672 | 0.497 |
LabTools calls (3)
stats.correlationlabtools stats correlation --a @Glucose.json --b @Lactate.json --method pearson
stats.correlationlabtools stats correlation --a @Succinate.json --b @Alanine.json --method spearman
stats.correlationlabtools stats correlation --a @Succinate.json --b @Alanine.json --method kendall
The same method is available as an MCP tool (stats_correlation) and from the desktop app's statistics panel.
Methods paragraph
Written to go straight into a manuscript.
Pearson correlations were computed for all 190 metabolite pairs (n = 60 samples); 45 pairs had |r| > 0.5, forming three co-varying blocks.
Every number on this page was computed by the LabTools statistics engine (version 0.14.3) from the example's CSV on 2026-09-23. Where a value was derived before the data reached LabTools (replicate means, paired differences, log odds ratios), the text says so. The data are simulated from a fixed random seed.
Get started
Run the same analysis on your data
Every test on this page is built into LabTools — from the statistics panel, the command line, or an AI assistant through MCP.