
All examples · Example 20 of 34
Heatmap: Gene Expression
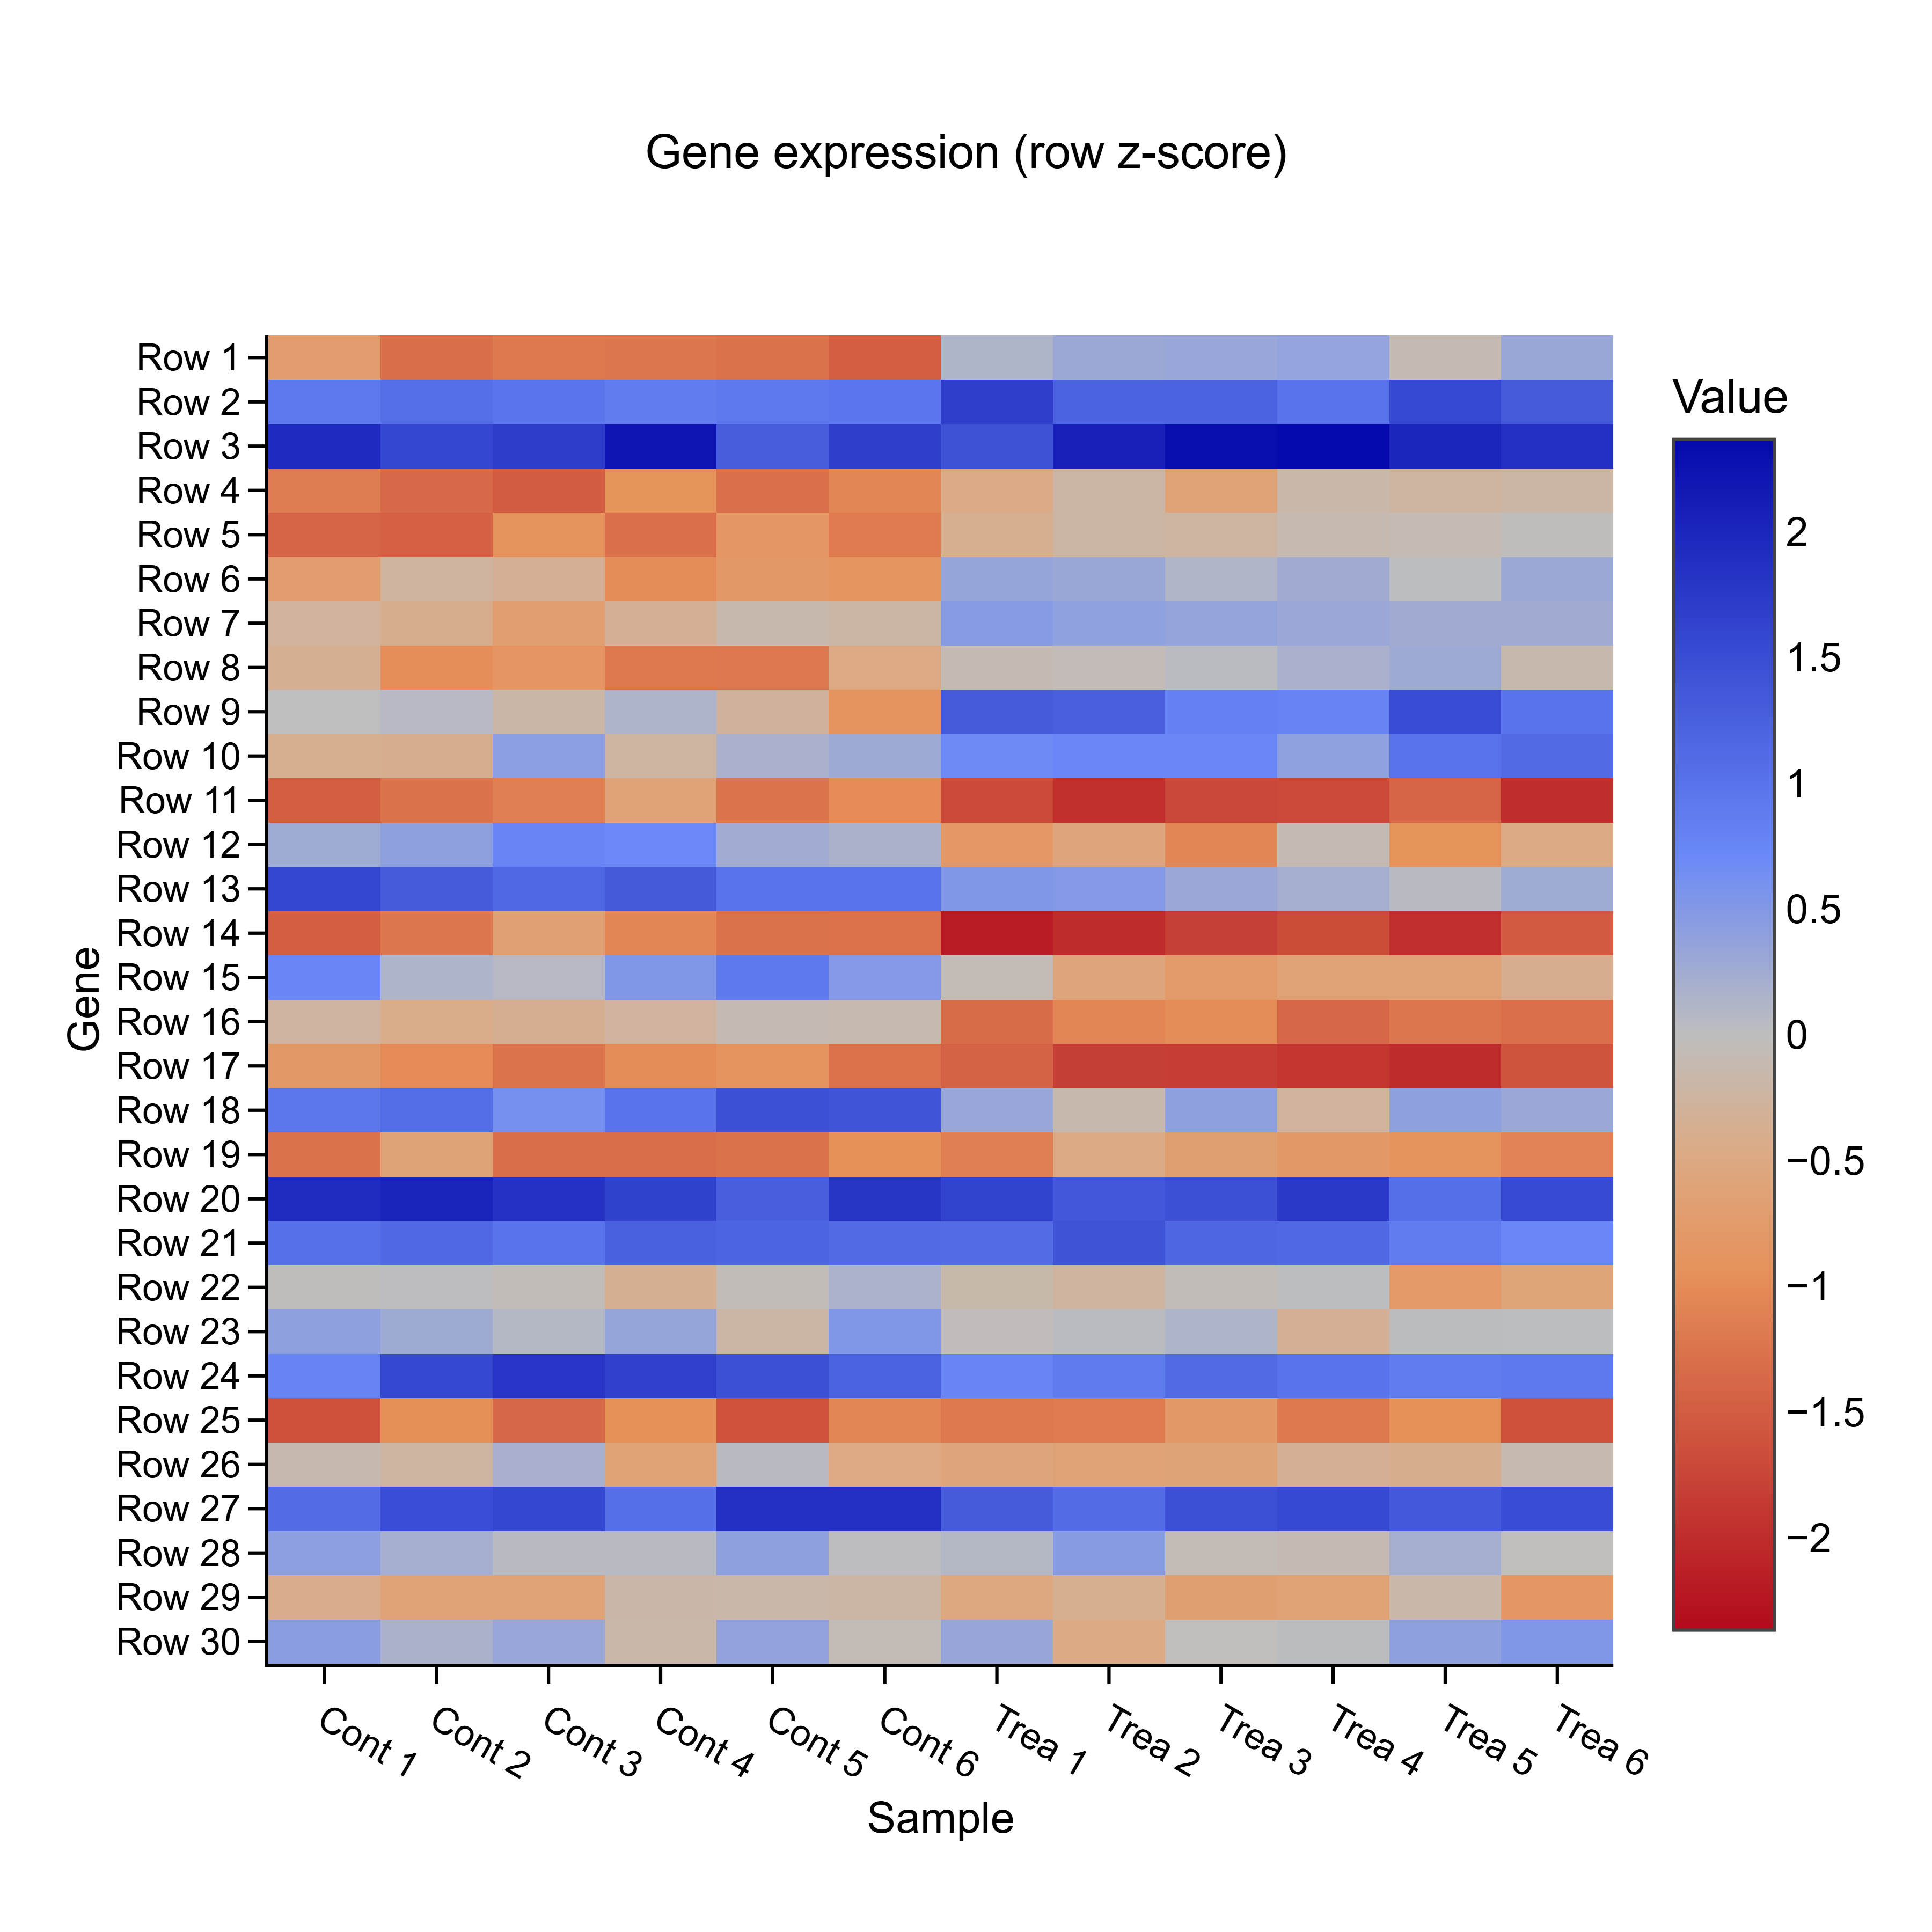
Row-standardised (z-score) log2 expression of 30 genes across 6 control and 6 treated samples.

Key findings
- After Benjamini–Hochberg correction, 10 genes are up and 8 down in treated samples.
- The data were simulated with 10 genes up, 8 down and 12 unchanged, so this doubles as a check on the method: with n = 6 per group the corrected tests flag 10 up and 8 down.
Gene-by-gene differential expression
Each of the 30 genes is compared between 6 control and 6 treated samples with Welch's t-test (the difference of log2 values is the log2 fold change), then the 30 p-values are corrected as one family.
30 tests, α = 0.05
| Correction | Controls | Tests | Raw p < 0.05 | Significant after correction |
|---|---|---|---|---|
| Bonferroni | family-wise error | 30 | 18 | 15 |
| Holm | family-wise error | 30 | 18 | 17 |
| Benjamini–Hochberg | false discovery rate | 30 | 18 | 18 |
| Benjamini–Yekutieli | false discovery rate | 30 | 18 | 17 |
LabTools calls (5)
stats.ttestlabtools stats ttest --a @Gene01_treated.json --b @Gene01_control.json --test welch --no-assumption-checks
stats.adjustlabtools stats adjust --p-values @p_values.json --labels @labels.json --method bonferroni --alpha 0.05
stats.adjustlabtools stats adjust --p-values @p_values.json --labels @labels.json --method holm --alpha 0.05
stats.adjustlabtools stats adjust --p-values @p_values.json --labels @labels.json --method benjamini-hochberg --alpha 0.05
stats.adjustlabtools stats adjust --p-values @p_values.json --labels @labels.json --method benjamini-yekutieli --alpha 0.05
The same method is available as an MCP tool (stats_ttest) and from the desktop app's statistics panel.
Top 30 by raw p
| Gene | log2 FC (treated − control) | Hedges' g | Raw p | Bonferroni | Holm | BH | BY |
|---|---|---|---|---|---|---|---|
| Gene01 | 2.55 | 6.44 | 2.8 × 10⁻⁷ | 8.3 × 10⁻⁶ | 8.3 × 10⁻⁶ | 8.3 × 10⁻⁶ | 3.3 × 10⁻⁵ |
| Gene16 | -1.61 | -5.1 | 4.2 × 10⁻⁶ | 0.0001 | 0.0001 | 6.4 × 10⁻⁵ | 0.0003 |
| Gene04 | 1.61 | 4.11 | 1.6 × 10⁻⁵ | 0.0005 | 0.0005 | 0.0001 | 0.0005 |
| Gene17 | -1.32 | -4.09 | 1.7 × 10⁻⁵ | 0.0005 | 0.0005 | 0.0001 | 0.0005 |
| Gene07 | 1.38 | 4.49 | 2.3 × 10⁻⁵ | 0.0007 | 0.0006 | 0.0001 | 0.0006 |
| Gene09 | 2.52 | 3.99 | 3.0 × 10⁻⁵ | 0.0009 | 0.0008 | 0.0001 | 0.0006 |
| Gene06 | 1.69 | 4.26 | 3.3 × 10⁻⁵ | 0.0010 | 0.0008 | 0.0001 | 0.0006 |
| Gene05 | 1.82 | 4.23 | 6.0 × 10⁻⁵ | 0.002 | 0.001 | 0.0002 | 0.0009 |
| Gene10 | 1.66 | 3.26 | 0.0002 | 0.006 | 0.004 | 0.0006 | 0.002 |
| Gene08 | 1.64 | 3.35 | 0.0002 | 0.006 | 0.004 | 0.0006 | 0.002 |
| Gene15 | -1.51 | -2.62 | 0.0008 | 0.023 | 0.015 | 0.002 | 0.008 |
| Gene12 | -1.68 | -2.69 | 0.0008 | 0.025 | 0.016 | 0.002 | 0.008 |
| Gene13 | -1.27 | -2.62 | 0.0010 | 0.029 | 0.017 | 0.002 | 0.009 |
| Gene18 | -1.26 | -2.29 | 0.002 | 0.047 | 0.027 | 0.003 | 0.012 |
| Gene14 | -1.28 | -2.29 | 0.002 | 0.047 | 0.027 | 0.003 | 0.012 |
| Gene02 | 1.07 | 2.63 | 0.003 | 0.094 | 0.047 | 0.006 | 0.023 |
| Gene11 | -1.14 | -2.11 | 0.003 | 0.099 | 0.047 | 0.006 | 0.023 |
| Gene03 | 1.01 | 1.42 | 0.024 | 0.72 | 0.31 | 0.040 | 0.16 |
| Gene19 | 0.463 | 0.904 | 0.12 | 1.00 | 1.00 | 0.19 | 0.77 |
| Gene24 | -0.419 | -0.876 | 0.14 | 1.00 | 1.00 | 0.22 | 0.86 |
| Gene21 | 0.316 | 0.778 | 0.18 | 1.00 | 1.00 | 0.26 | 1.00 |
| Gene23 | -0.25 | -0.663 | 0.25 | 1.00 | 1.00 | 0.34 | 1.00 |
| Gene27 | 0.291 | 0.6 | 0.29 | 1.00 | 1.00 | 0.37 | 1.00 |
| Gene26 | -0.256 | -0.555 | 0.32 | 1.00 | 1.00 | 0.40 | 1.00 |
| Gene22 | -0.246 | -0.498 | 0.39 | 1.00 | 1.00 | 0.46 | 1.00 |
| Gene29 | -0.186 | -0.402 | 0.47 | 1.00 | 1.00 | 0.54 | 1.00 |
| Gene30 | 0.152 | 0.258 | 0.64 | 1.00 | 1.00 | 0.70 | 1.00 |
| Gene25 | 0.151 | 0.249 | 0.65 | 1.00 | 1.00 | 0.70 | 1.00 |
| Gene28 | 0.0415 | 0.115 | 0.83 | 1.00 | 1.00 | 0.86 | 1.00 |
| Gene20 | 0.00433 | 0.00697 | 0.99 | 1.00 | 1.00 | 0.99 | 1.00 |
LabTools notes
- 3 comparison(s) were significant on the raw p-values but are not after correction. Report the adjusted values.
- Holm controls the same familywise error rate as Bonferroni and rejects at least as much, so there is no statistical reason to prefer bonferroni.
- 1 comparison(s) were significant on the raw p-values but are not after correction. Report the adjusted values.
Methods paragraph
Written to go straight into a manuscript.
log2 expression was z-scored within each gene; the matrix shows clear blocks of genes induced and repressed in treated samples.
Every number on this page was computed by the LabTools statistics engine (version 0.14.3) from the example's CSV on 2026-09-23. Where a value was derived before the data reached LabTools (replicate means, paired differences, log odds ratios), the text says so. The data are simulated from a fixed random seed.
Get started
Run the same analysis on your data
Every test on this page is built into LabTools — from the statistics panel, the command line, or an AI assistant through MCP.