
All examples · Example 16 of 34
Forest Plot: Meta-Analysis
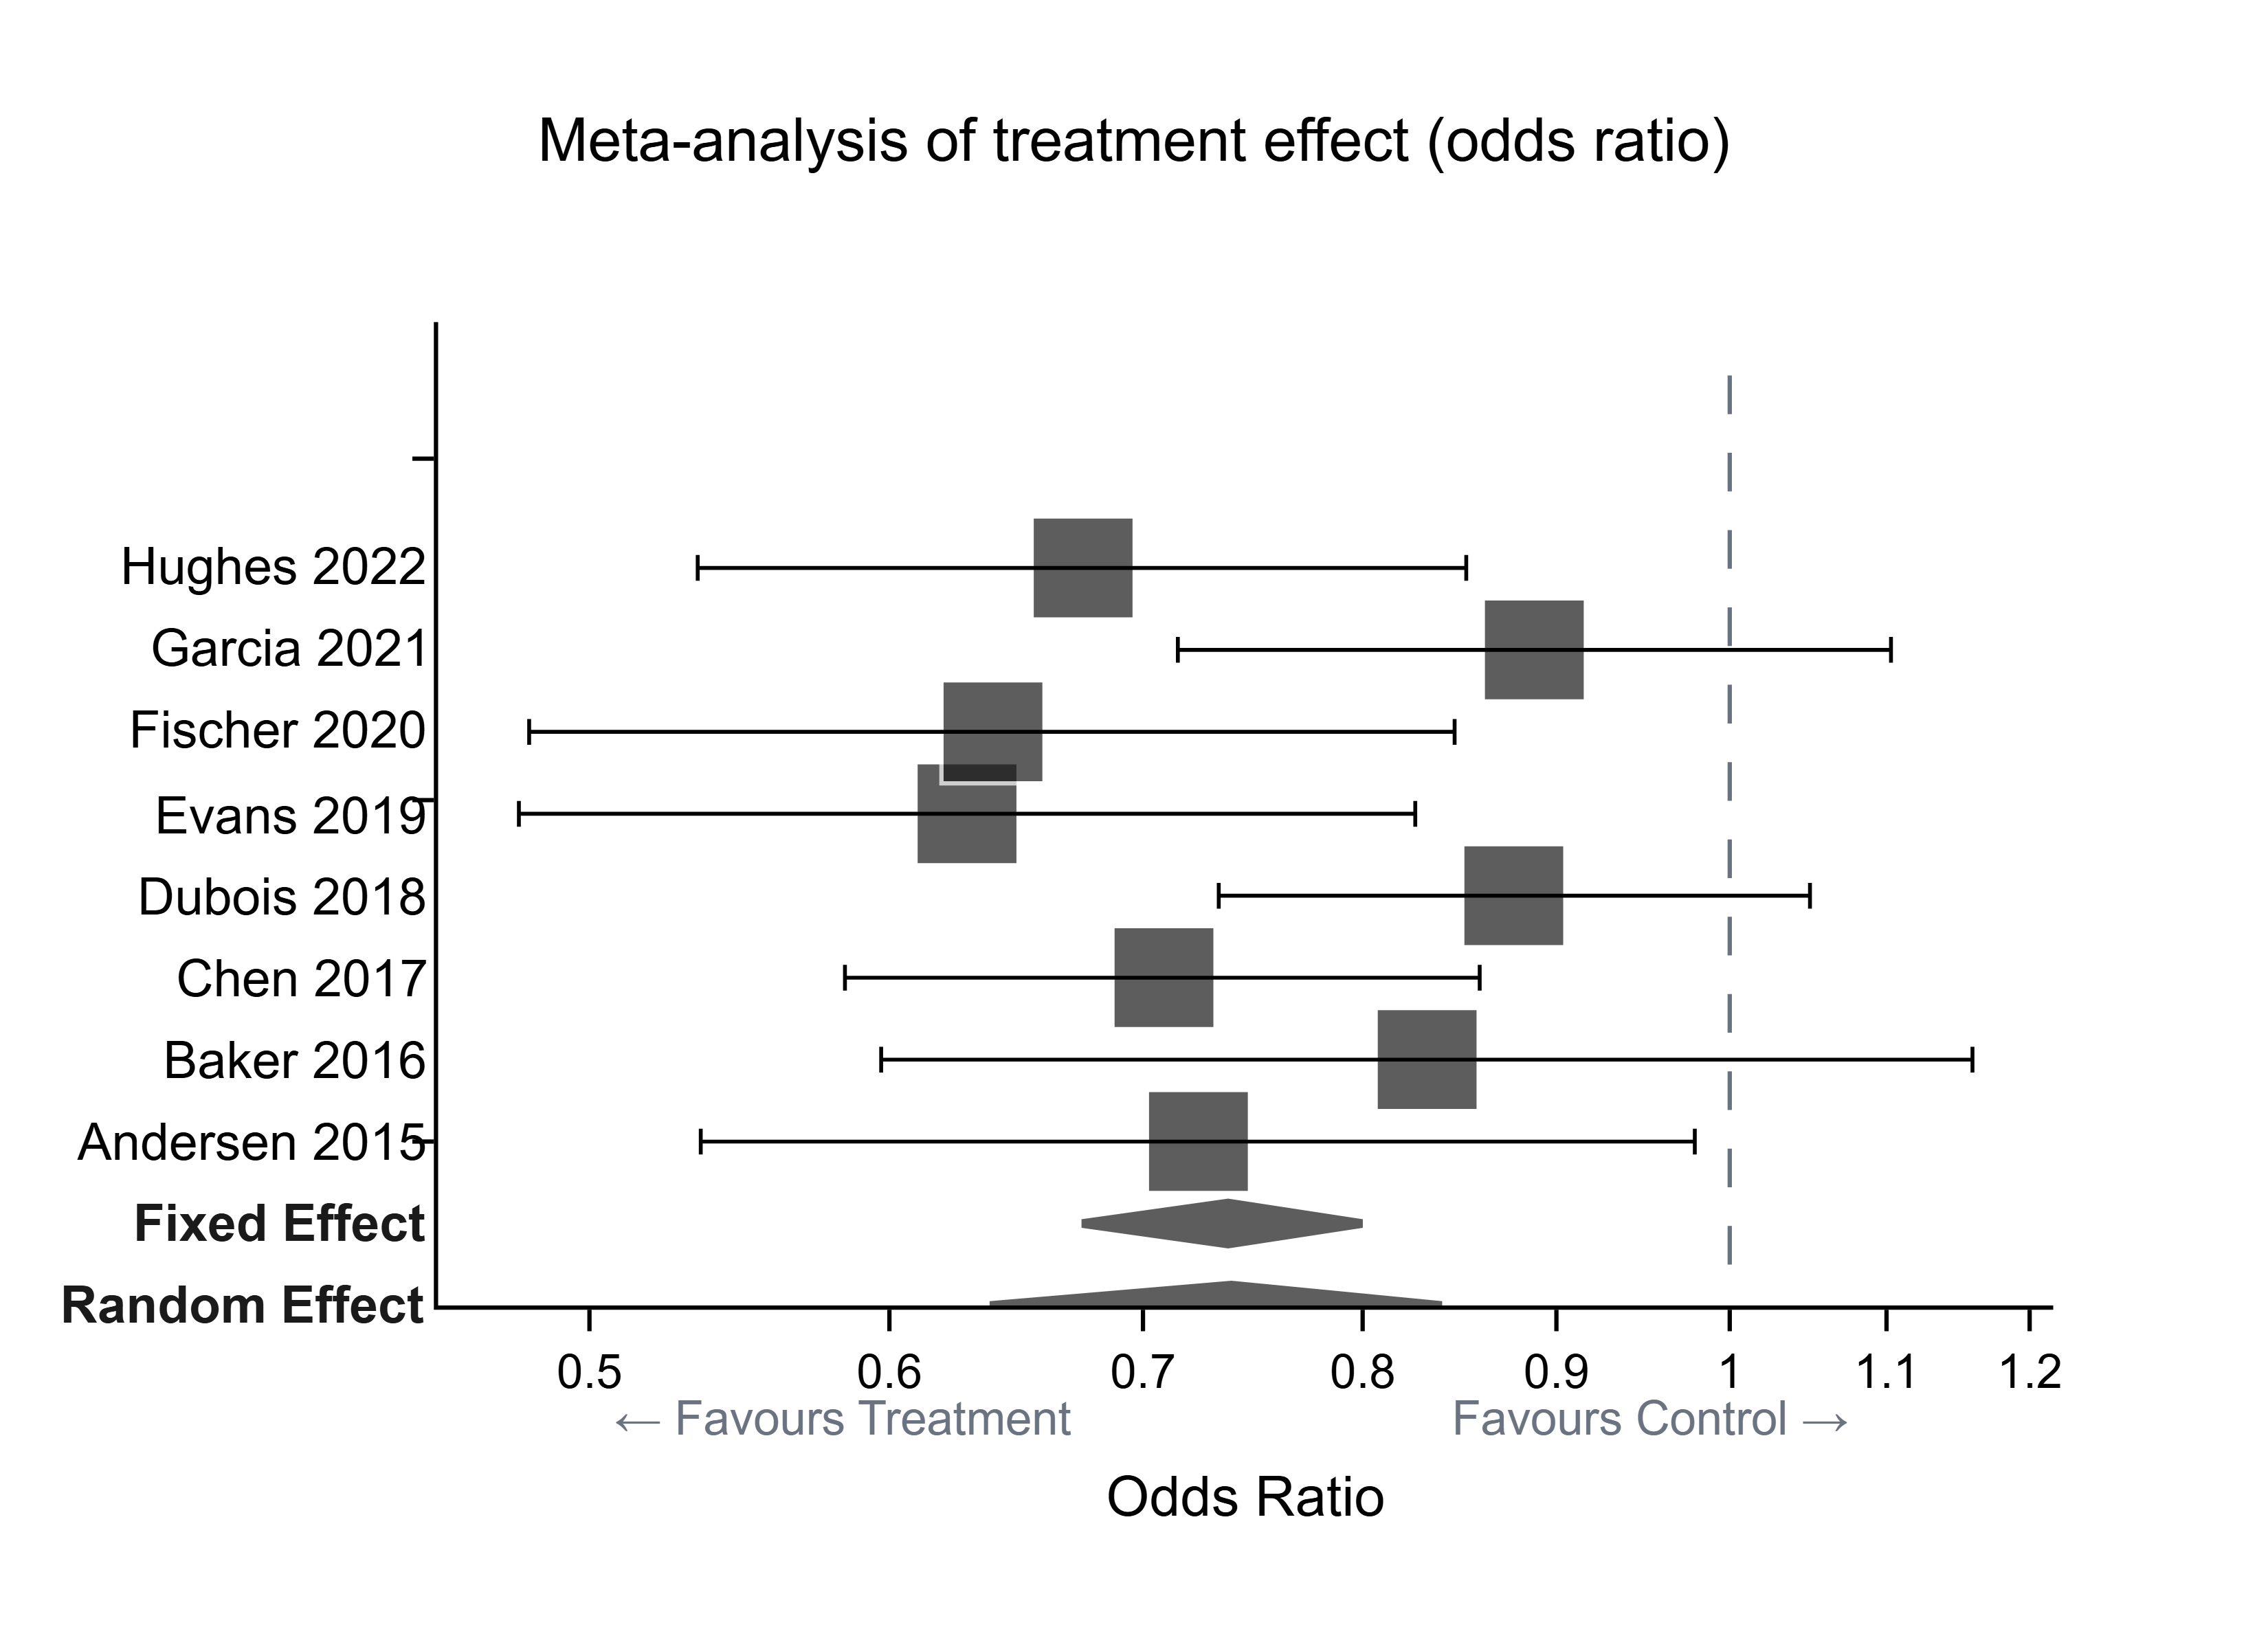
Odds ratios with 95% CIs from eight studies; diamonds show the fixed- and random-effect pooled estimates.

Key findings
- All eight studies favour treatment (every OR < 1; log(OR) mean -0.301).
- No sign of small-study effects: Kendall τ between study size and log(OR) = 0.143 (p = 0.62).
Study-level estimates
The eight studies as drawn. Log odds ratios are used below because odds ratios are multiplicative — log(OR) is the scale on which effects add and pooling is done (the logs are computed here, before the data reach LabTools).
| Study | N | Odds ratio | 95% CI | log(OR) |
|---|---|---|---|---|
| Andersen 2015 | 203 | 0.724 | [0.535, 0.979] | -0.323 |
| Baker 2016 | 169 | 0.832 | [0.597, 1.159] | -0.184 |
| Chen 2017 | 500 | 0.709 | [0.584, 0.859] | -0.344 |
| Dubois 2018 | 574 | 0.877 | [0.733, 1.05] | -0.131 |
| Evans 2019 | 251 | 0.629 | [0.479, 0.826] | -0.464 |
| Fischer 2020 | 236 | 0.639 | [0.482, 0.846] | -0.448 |
| Garcia 2021 | 396 | 0.888 | [0.715, 1.103] | -0.119 |
| Hughes 2022 | 340 | 0.675 | [0.534, 0.852] | -0.393 |
Spread of the study effects
Location, spread and shape for every group — the first thing to read before choosing a test. Skewness near 0 and excess kurtosis near 0 are what a normal distribution looks like.
| Group | n | Mean | SD | SEM | Median | Q1 – Q3 | Min – Max | Skewness | Excess kurtosis |
|---|---|---|---|---|---|---|---|---|---|
| log(OR) | 8 | -0.3007 | 0.1386 | 0.04901 | -0.3334 | -0.4067 – -0.1708 | -0.4636 – -0.1188 | 0.291 | -1.79 |
LabTools call
stats.describelabtools stats describe --groups @groups.json
The same method is available as an MCP tool (stats_describe) and from the desktop app's statistics panel.
Normality
Three tests of the same question — could these values come from a normal distribution? Shapiro–Wilk has the best power at bench sample sizes, Anderson–Darling is more sensitive in the tails, and Kolmogorov–Smirnov (Lilliefors-corrected) is included for comparability with older papers. A significant p means normality is rejected.
| Group | n | Shapiro–Wilk W | p | Anderson–Darling A² | p | Verdict |
|---|---|---|---|---|---|---|
| log(OR) | 8 | 0.8929 | 0.25 | 0.3746 | 0.32 | Consistent with normal |
LabTools calls (2)
stats.normalitylabtools stats normality --groups @groups.json --method shapiro-wilk
stats.normalitylabtools stats normality --groups @groups.json --method anderson-darling
The same method is available as an MCP tool (stats_normality) and from the desktop app's statistics panel.
LabTools notes
- Group 'log(OR)' has n = 8; normality screening has very low power at this size, so a non-significant Shapiro–Wilk is weak evidence of normality.
Small-study effects
A quick check behind a funnel plot: do smaller studies report larger effects? A rank correlation between study size and log(OR) near zero is reassuring. With 8 studies the power is low, and LabTools says so.
| Coefficient | Estimate | r² | n | p |
|---|---|---|---|---|
| Pearson r (linear) | 0.393 | 0.1545 | 8 | 0.34 |
| Spearman ρ (monotonic, rank) | 0.2619 | — | 8 | 0.53 |
| Kendall τ (rank, tie-robust; normal-approximation p) | 0.1429 | — | 8 | 0.62 |
LabTools calls (3)
stats.correlationlabtools stats correlation --a @N.json --b @log(OR).json --method pearson
stats.correlationlabtools stats correlation --a @N.json --b @log(OR).json --method spearman
stats.correlationlabtools stats correlation --a @N.json --b @log(OR).json --method kendall
The same method is available as an MCP tool (stats_correlation) and from the desktop app's statistics panel.
LabTools notes
- n = 8 is small; the confidence in this coefficient is very low whatever the p-value says.
- Pearson's r measures LINEAR association only, and is sensitive to outliers. A scatter plot (plot.create kind='scatter') is worth a look before reporting it; use method='spearman' if the relationship is monotonic but curved.
Methods paragraph
Written to go straight into a manuscript.
Study odds ratios ranged from 0.63 to 0.89. The pooled odds ratio drawn by LabTools was 0.74 (fixed effect, 95% CI 0.68–0.80), favouring treatment.
Every number on this page was computed by the LabTools statistics engine (version 0.14.3) from the example's CSV on 2026-09-23. Where a value was derived before the data reached LabTools (replicate means, paired differences, log odds ratios), the text says so. The data are simulated from a fixed random seed.
Get started
Run the same analysis on your data
Every test on this page is built into LabTools — from the statistics panel, the command line, or an AI assistant through MCP.