
All examples · Example 33 of 34
Clustering: Single-Cell Embedding
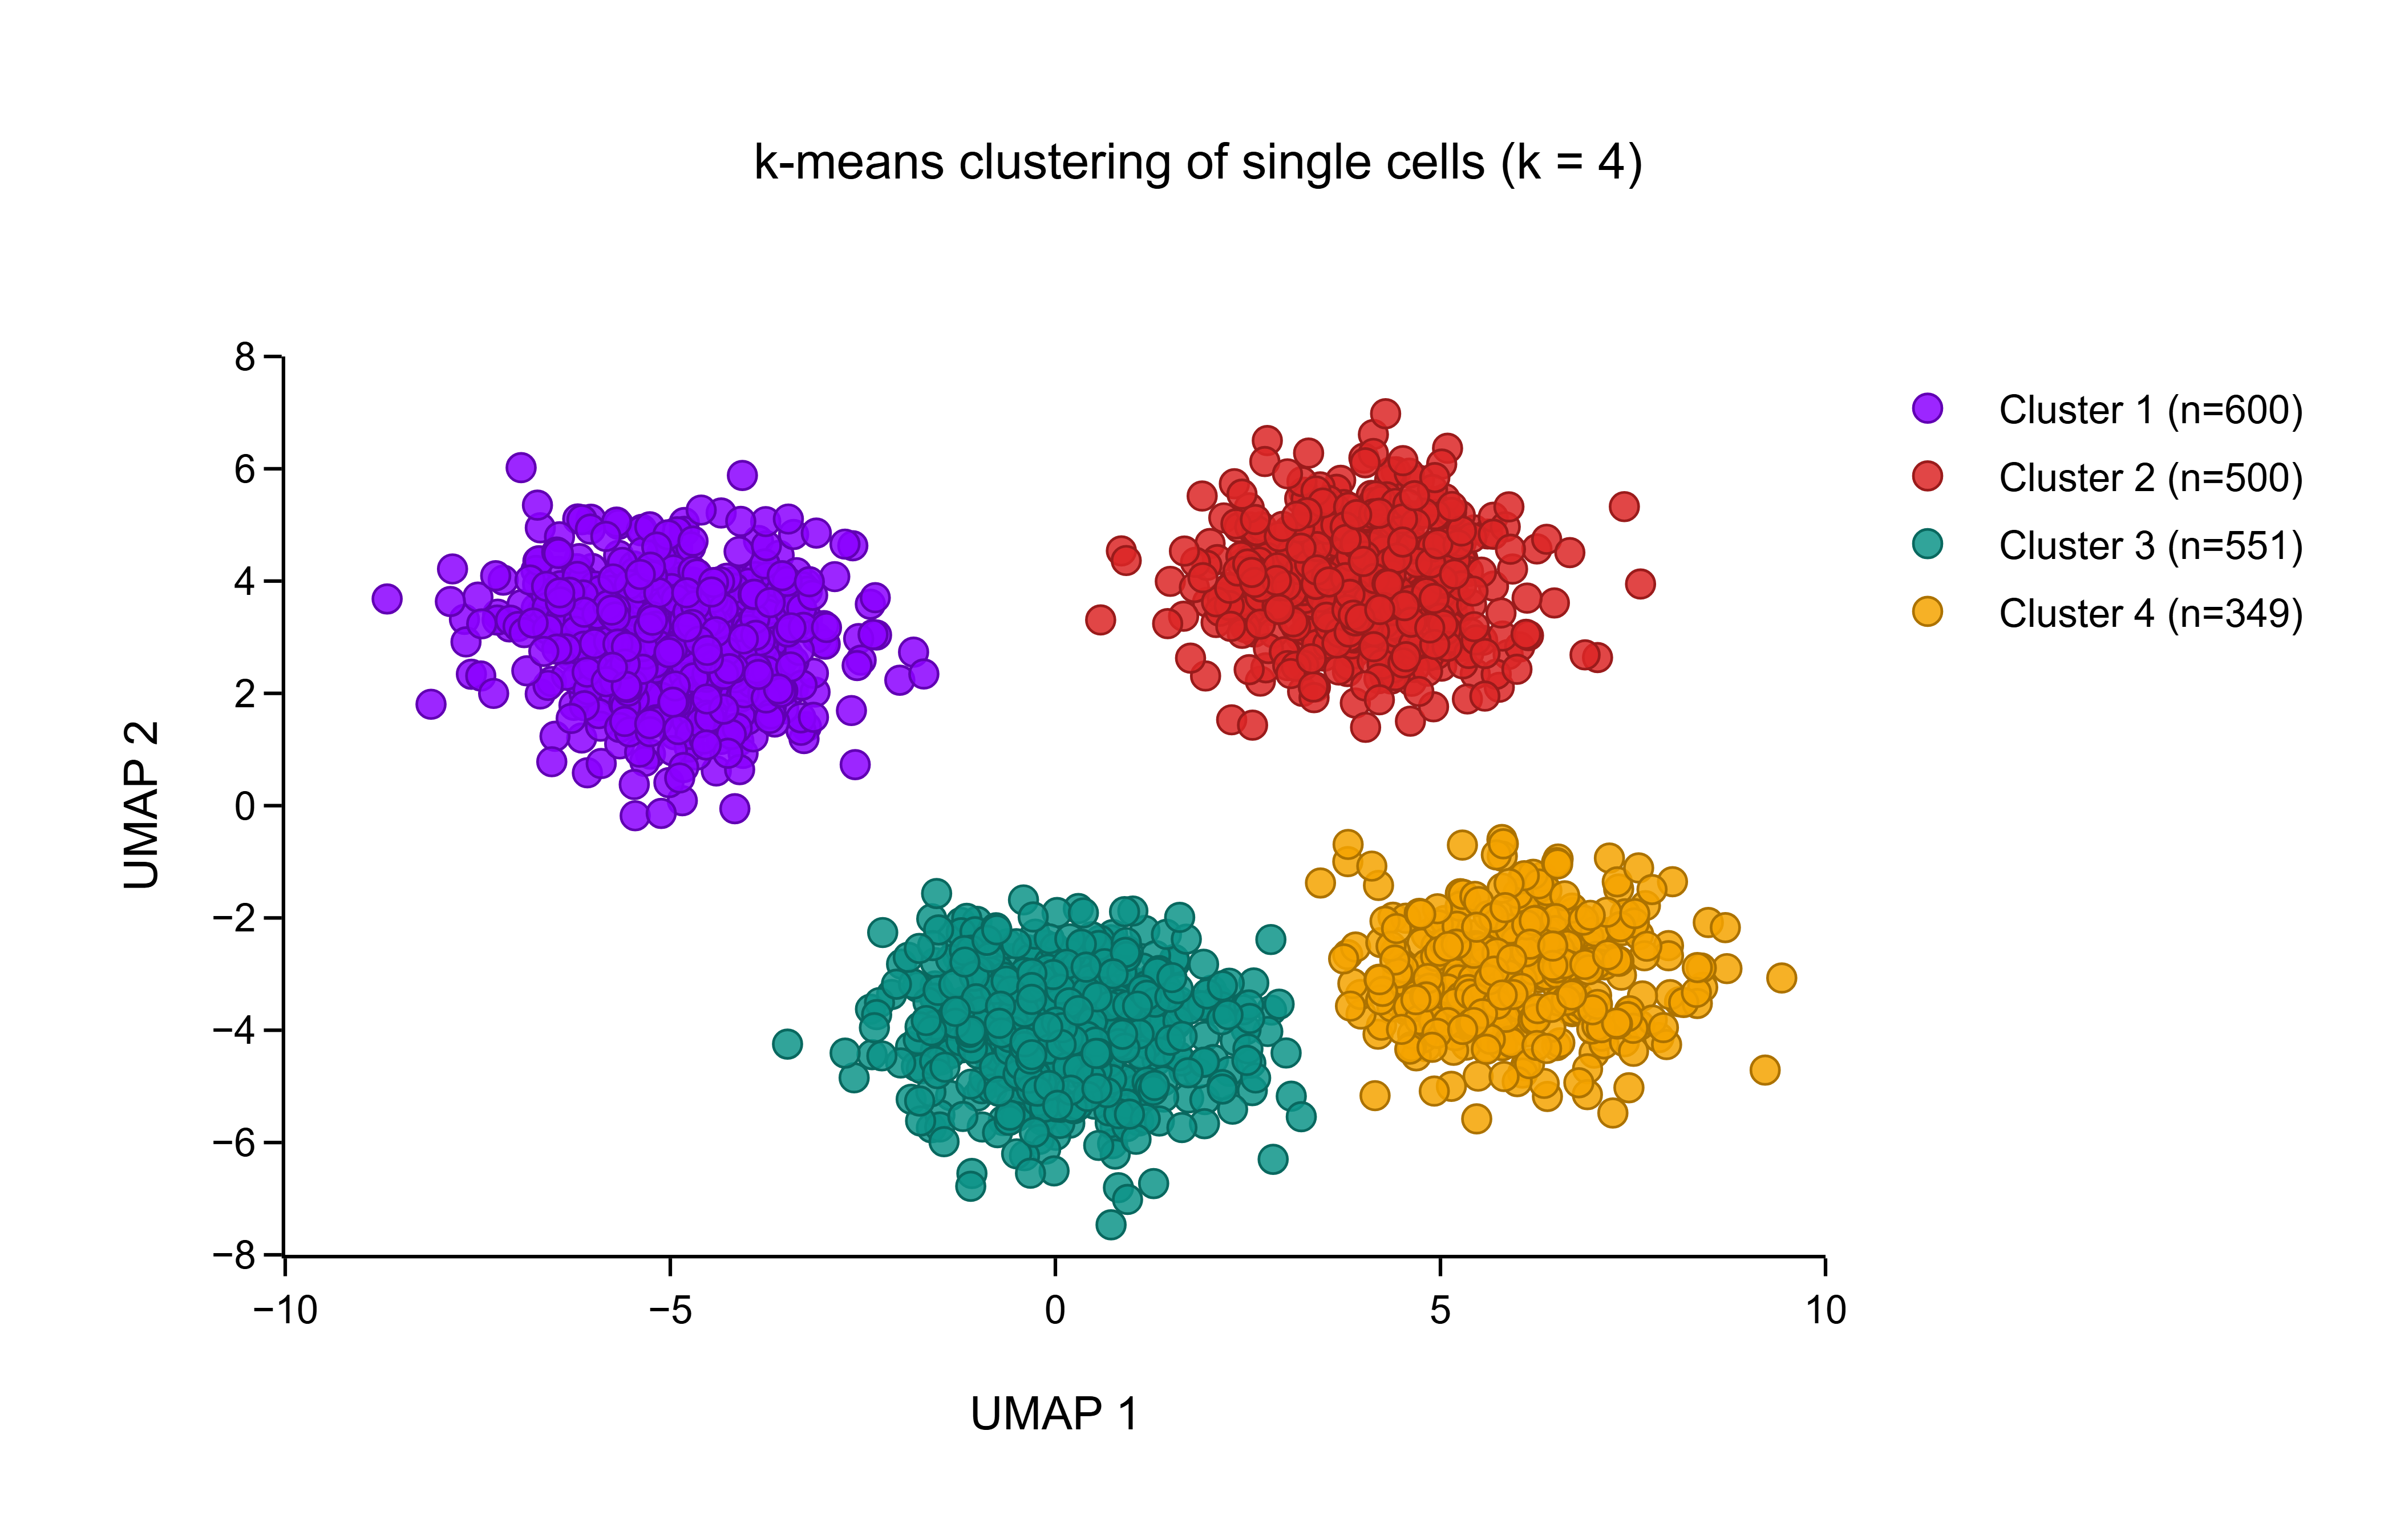
k-means clustering (k = 4) of 2,000 cells on a two-dimensional UMAP embedding.

Key findings
- k-means found 4 clusters of 600, 500, 551, 349 cells.
- Projected onto single axes, BIC finds 3 components on UMAP 1 and 2 on UMAP 2 — clusters overlap in one dimension and separate only in two.
Descriptive statistics
Location, spread and shape for every group — the first thing to read before choosing a test. Skewness near 0 and excess kurtosis near 0 are what a normal distribution looks like.
| Group | n | Mean | SD | SEM | Median | Q1 – Q3 | Min – Max | Skewness | Excess kurtosis |
|---|---|---|---|---|---|---|---|---|---|
| UMAP 1 | 2,000 | 0.5741 | 4.292 | 0.09598 | 0.802 | -3.892 – 4.34 | -8.677 – 9.432 | -0.171 | -1.25 |
| UMAP 2 | 2,000 | 0.2619 | 3.679 | 0.08227 | 1.91 | -3.452 – 3.566 | -7.466 – 6.98 | -0.175 | -1.61 |
LabTools call
stats.describelabtools stats describe --groups @groups.json
The same method is available as an MCP tool (stats_describe) and from the desktop app's statistics panel.
Normality
Three tests of the same question — could these values come from a normal distribution? Shapiro–Wilk has the best power at bench sample sizes, Anderson–Darling is more sensitive in the tails, and Kolmogorov–Smirnov (Lilliefors-corrected) is included for comparability with older papers. A significant p means normality is rejected.
| Group | n | Shapiro–Wilk W | p | Anderson–Darling A² | p | Verdict |
|---|---|---|---|---|---|---|
| UMAP 1 | 2,000 | 0.9422 | 2.8 × 10⁻²⁷ | 38.91 | 3.7 × 10⁻²⁴ | Normality rejected |
| UMAP 2 | 2,000 | 0.8752 | 2.5 × 10⁻³⁷ | 111.9 | 3.7 × 10⁻²⁴ | Normality rejected |
LabTools calls (2)
stats.normalitylabtools stats normality --groups @groups.json --method shapiro-wilk
stats.normalitylabtools stats normality --groups @groups.json --method anderson-darling
The same method is available as an MCP tool (stats_normality) and from the desktop app's statistics panel.
LabTools notes
- Group 'UMAP 1' rejects normality (p = 0.0000); prefer a rank-based test.
- Group 'UMAP 1' has n = 2000; at this size a normality test flags departures far too small to affect a t-test. Judge by the skewness/kurtosis and a QQ plot instead.
- Group 'UMAP 2' rejects normality (p = 0.0000); prefer a rank-based test.
- Group 'UMAP 2' has n = 2000; at this size a normality test flags departures far too small to affect a t-test. Judge by the skewness/kurtosis and a QQ plot instead.
Populations along each embedding axis
A 1-D Gaussian mixture on each UMAP axis, k = 1–5. Structure in one dimension is a lower bound on the clusters in two — k-means on the full embedding found 4.
UMAP 1 (n = 2,000) — best k by BIC = 3, by AIC = 3
| k | log-likelihood | AIC | BIC | Converged | Components (weight, mean, SD) |
|---|---|---|---|---|---|
| 1 | -5,750.97 | 11,505.9 | 11,517.1 | yes | 100.0% at μ = 0.5741 (σ = 4.291) |
| 2 | -5,420.6 | 10,851.2 | 10,879.2 | yes | 27.8% at μ = -5.061 (σ = 1.014); 72.2% at μ = 2.749 (σ = 2.853) |
| 3 ★ | -5,301.04 | 10,618.1 | 10,662.9 | yes | 29.9% at μ = -4.969 (σ = 1.076); 25.0% at μ = -0.05534 (σ = 1.05); 45.1% at μ = 4.602 (σ = 1.627) |
| 4 | -5,300.8 | 10,623.6 | 10,685.2 | no | 15.6% at μ = -5.093 (σ = 1.144); 14.3% at μ = -4.842 (σ = 0.9699); 25.1% at μ = -0.05693 (σ = 1.056); 45.0% at μ = 4.604 (σ = 1.626) |
| 5 | -5,301.19 | 10,630.4 | 10,708.8 | no | 13.4% at μ = -5.211 (σ = 1.126); 16.2% at μ = -4.804 (σ = 0.9634); 17.3% at μ = -0.1056 (σ = 0.9513); 9.5% at μ = 0.3548 (σ = 1.596); 43.5% at μ = 4.681 (σ = 1.587) |
LabTools call
stats.gmmlabtools stats gmm --groups @groups.json --k-max 5
The same method is available as an MCP tool (stats_gmm) and from the desktop app's statistics panel.
UMAP 2 (n = 2,000) — best k by BIC = 2, by AIC = 2
| k | log-likelihood | AIC | BIC | Converged | Components (weight, mean, SD) |
|---|---|---|---|---|---|
| 1 | -5,442.84 | 10,889.7 | 10,900.9 | yes | 100.0% at μ = 0.2619 (σ = 3.678) |
| 2 ★ | -4,442.49 | 8,894.97 | 8,922.98 | yes | 45.1% at μ = -3.603 (σ = 1.131); 54.9% at μ = 3.436 (σ = 1.118) |
| 3 | -4,442.18 | 8,900.36 | 8,945.16 | no | 45.1% at μ = -3.605 (σ = 1.128); 16.0% at μ = 3.138 (σ = 1.205); 39.0% at μ = 3.556 (σ = 1.061) |
| 4 | -4,441.87 | 8,905.73 | 8,967.34 | no | 24.5% at μ = -3.733 (σ = 1.199); 20.6% at μ = -3.454 (σ = 1.017); 23.7% at μ = 3.233 (σ = 1.193); 31.2% at μ = 3.586 (σ = 1.038) |
| 5 | -4,441.88 | 8,911.76 | 8,990.17 | no | 15.0% at μ = -3.905 (σ = 1.193); 30.0% at μ = -3.459 (σ = 1.059); 1.5% at μ = 2.183 (σ = 1.295); 19.8% at μ = 3.395 (σ = 1.137); 33.7% at μ = 3.51 (σ = 1.074) |
LabTools call
stats.gmmlabtools stats gmm --groups @groups.json --k-max 5
The same method is available as an MCP tool (stats_gmm) and from the desktop app's statistics panel.
LabTools notes
- 'UMAP 1': BIC prefers 3 components over 1 — the column looks like a mixture, not a single population.
- 'UMAP 2': BIC prefers 2 components over 1 — the column looks like a mixture, not a single population.
Axis association
| Coefficient | Estimate | r² | n | p |
|---|---|---|---|---|
| Pearson r (linear) | -0.2532 | 0.06411 | 2,000 | 1.3 × 10⁻³⁰ |
| Spearman ρ (monotonic, rank) | -0.1218 | — | 2,000 | 4.7 × 10⁻⁸ |
| Kendall τ (rank, tie-robust; normal-approximation p) | -0.08861 | — | 2,000 | 2.9 × 10⁻⁹ |
LabTools calls (3)
stats.correlationlabtools stats correlation --a @UMAP_1.json --b @UMAP_2.json --method pearson
stats.correlationlabtools stats correlation --a @UMAP_1.json --b @UMAP_2.json --method spearman
stats.correlationlabtools stats correlation --a @UMAP_1.json --b @UMAP_2.json --method kendall
The same method is available as an MCP tool (stats_correlation) and from the desktop app's statistics panel.
LabTools notes
- Pearson's r measures LINEAR association only, and is sensitive to outliers. A scatter plot (plot.create kind='scatter') is worth a look before reporting it; use method='spearman' if the relationship is monotonic but curved.
Methods paragraph
Written to go straight into a manuscript.
k-means with k = 4 recovered four populations of 600, 500, 551 and 349 cells.
Every number on this page was computed by the LabTools statistics engine (version 0.14.3) from the example's CSV on 2026-09-23. Where a value was derived before the data reached LabTools (replicate means, paired differences, log odds ratios), the text says so. The data are simulated from a fixed random seed.
Get started
Run the same analysis on your data
Every test on this page is built into LabTools — from the statistics panel, the command line, or an AI assistant through MCP.